A) \[\frac{{{E}_{a}}}{2.303R}\]
B) \[-\frac{{{E}_{a}}}{R}\]
C) \[-\frac{{{E}_{a}}}{2.303R}\]
D) \[\log A\]
Correct Answer: C
Solution :
The Arrhenius equation can be written as \[\log \,K=\log A-\frac{E}{2.303RT}\] On comparing this equation with general equation of a straight line, \[y=mx+c\] We get, \[y=\log \,K,\] \[x=\frac{1}{T},\] \[m=-\frac{E}{2.303R},\] \[c=\log A\] i.e., if we plot a graph between log K (at Y-axis) and \[\frac{1}{T}\](at X-axis), then the slope of the line obtained will be equal to \[-\frac{e}{2.303\,R}.\]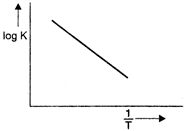


You need to login to perform this action.
You will be redirected in
3 sec

