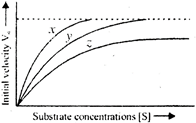
A) x-normal enzyme reaction, y-competitive inhibition, z-non-competitive inhibition
B) x-enzyme with an allosteric modulator added, y-normal enzyme activity, z-competitive inhibition
C) x-enzyme with an allosteric stimulator, y-competitive inhibition added, z-normal enzyme reaction
D) x-normal enzyme reaction, y-non-competitive inhibitor added, z-allosteric inhibitor added
Correct Answer: A


You need to login to perform this action.
You will be redirected in
3 sec

