
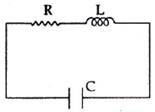
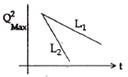
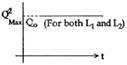
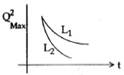
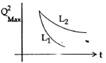
 If a student plots graphs of the square of maximum charge \[\left( Q_{Max}^{2} \right)\]on the capacitor with time (t) for two different values \[{{L}_{1}}\] and \[{{L}_{2}}\] \[\left( {{L}_{1}}>{{L}_{2}} \right)\]of L then which of the following represents this graph correctly ? (plots are schematic and not drawn ot scale)
[JEE Main Solved Paper-2015 ]
If a student plots graphs of the square of maximum charge \[\left( Q_{Max}^{2} \right)\]on the capacitor with time (t) for two different values \[{{L}_{1}}\] and \[{{L}_{2}}\] \[\left( {{L}_{1}}>{{L}_{2}} \right)\]of L then which of the following represents this graph correctly ? (plots are schematic and not drawn ot scale)
[JEE Main Solved Paper-2015 ]







You need to login to perform this action.
You will be redirected in
3 sec