| Directions: Study the following pie-chart and table carefully to answer the questions 28 & 29 given below : | ||||||||||||||||||||||||||||
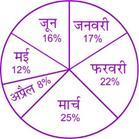
| Pie-chart shows percentage wise distribution of the number of cars sold by two distributors (A and B) together during first six months. Total number of cars sold is 1500. | ||||||||||||||||||||||||||||
| Table shows the respective ratio between the | ||||||||||||||||||||||||||||
| number of cars sold of company A and compan B during six months. | ||||||||||||||||||||||||||||
| निर्देश: प्रश्न 28 एवं 29 का उत्तर देने के लिए नीचे दिए गए पाई चित्र और तालिका का अध्ययन करियेः | ||||||||||||||||||||||||||||
| पहले छह महीने के दौरान, दो वितरकों (A और B) द्वारा बेची गई कारों की संख्या पाई चित्र में वितरण प्रतिशत के रूप में दर्शायी गई है। बेची गयी कारों की कुल संख्या 1500 है। | ||||||||||||||||||||||||||||
| छह महीनों के अन्दर कम्पनी A और कम्पनी B के द्वारा बेची गई कारों का क्रमिक अनुपात, तालिका में दिखाया गया है। | ||||||||||||||||||||||||||||
 |
||||||||||||||||||||||||||||
|
||||||||||||||||||||||||||||
| What is the respective ratio between the number of cars sold of company B during January and those sold during June of the same company? | ||||||||||||||||||||||||||||
| कम्पनी B द्वारा जनवरी में बेची गयी और जून में बेची गयी कारों की संख्या का क्रमश: अनुपात क्या है? |
A) 116:135
B) 119: 145
C) 116: 145
D) 119: 135
Correct Answer:


You need to login to perform this action.
You will be redirected in
3 sec

