| The oscillation of a body on a smooth horizontal surface is represented by the equation,\[X=A\cos (\omega t)\] [NEET 2014] |
| where \[X=\] displacement at time t |
| \[\omega =\] frequency of oscillation |
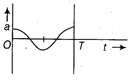
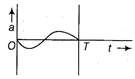
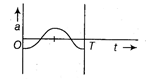
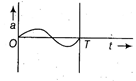
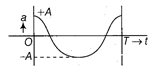
| Which one of the following graphs shows correctly the variation a with t? |
A)
B)
C)
D)
 Here, \[a=\] acceleration at time t \[T=\] time period
Correct Answer: A
Solution :
| We can find the correct graph by putting different values of t in the given expression |
| \[x=A\cos (\omega t)\] |
| \[\Rightarrow \] At \[t=0,x=+A\] |
| and \[t=\frac{T}{4},x=A\cos \left( \frac{2\pi }{T}\times \frac{T}{4} \right)=A\cos (\pi /2)=0\] |
| Again \[t=\frac{T}{2},x=A\cos \left( \frac{2\pi }{T}\times \frac{T}{2} \right)=A\cos \pi =-A\] |
| We can see that, only graph (i) will satisfy the above results |
 |


You need to login to perform this action.
You will be redirected in
3 sec

