Answer:
In the diagram \[\overline{C}+bY\] is the consumption curve. The \[45{}^\circ \] line is the aggregate supply curve. At point E, consumption = income i.e. (\[Y=\overline{C}\]) \[\overline{C}\] represents the autonomous consumption i.e., consumption at zero level of income. Steps for derivation of supply curve from consumption curve as follows: (i) Corresponding to \[\overline{C}\] in the consumption function we have - \[\overline{C}\] in the saving function. That is, there are negative savings equal to autonomous consumption at Y = 0. This is represented by S on the negative axis in the lower panel. (ii) At point E (\[Y=\overline{C}\]). This implies that all the income is spent on consumption expenditure. Thus, savings equal to zero. This is shown as S = 0 in lower panel. This point is also known as the Break-even point. 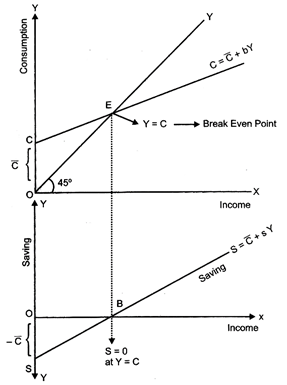
(iii) Beyond the break-even point, by connecting points S and Y we derive the straight upward sloping saving curve. (iv) SS is the required saving curve.


You need to login to perform this action.
You will be redirected in
3 sec

