| Explain the meaning of opportunity cost with the help of production possibility schedule. |
| Or |
| With the help of suitable example explain the problem of for whom to produce. |
Answer:
The cost of enjoying more of one good in terms of sacrificing the benefit of another good is called opportunity cost of the additional unit of the good. Let us consider the example of the economy producing two goods - consumer goods and capital goods assuming the level of resources and technology remain same. The following schedule depicts the different possible combinations of the consumer goods and the capital goods that the economy can produce with its resource endowment and the available technology. This schedule is called production possibility schedule. Production Possibility schedule refers to the table showing different production possibilities of two goods with the given resources & technology. Production Possibilities Consumer Good (units) Capital Goods (units) A 50 0 B 48 1 C 44 2 D 35 3 E 0 4 From the schedule, we can see that point A shows, if all the resources are utilized in the production of the consumer goods, then 50 units of consumer goods can be produced with zero units of capital goods. On the other hand, point E shows that if all the resources are utilized in the production of the capital goods, then 4 units of capital goods can be produced with zero units of consumer goods. Also, consider the movement from point B to point C It implies that the economy is diverting resources from the production of consumer goods to1 the production of capital goods. In order to produce one additional unit of capital goods, the economy needs to sacrifice four units of consumer goods. Thus, the opportunity cost of producing one additional unit of capital goods is four units of consumer goods. Or This economic problem basically focuses on the distribution of final goods and services produced. The distribution of the final goods and services is equivalent to the distribution of National Income (or National Product) among the factor of production such as land, labour, capital and entrepreneur. For instance, imagine an economy producing two goods - normal rice (priced at Rs 15/kg) and graded rice (priced as Rs 100/kg). If the economy decides to cater the needs of the lower section of the society, then it would produce more or normal rice and less of the graded rice. In such a case, the PPC curve will be as depicted in figure (ii). On the other hand, if the economy decided to cater the needs of the higher section of the society, then it would produce more of the graded rice and less of the normal rice. In such a case, the PPC curve will be as depicted in figure (i). 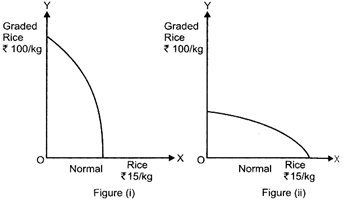


You need to login to perform this action.
You will be redirected in
3 sec

