Answer:
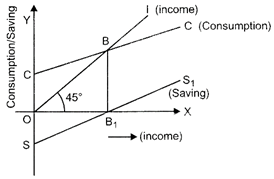
In the above diagram: CC = Consumption function \[OI={{45}^{o}}\] degree line showing income drawn from the origin O. B = Breakeven point where consumption = income, i.e, a point where there is no saving. Following are the steps used in drawing saving curve from consumption function: (1) Take a point B on consumption curve and from it draw a perpendicular on x-axis intersecting it a point Bi. (2) Take OS on Y-axis of lower part as equal to OC (OS = OC). This gives point S from where saving curve will start. (3) Join points S and B, and extend the straight line onward and thus we get saving curve\[S{{B}_{1}}\,\,{{S}_{1.}}\] In this way saving curve is diagrammatically drawn from consumption curve.


You need to login to perform this action.
You will be redirected in
3 sec

