Answer:
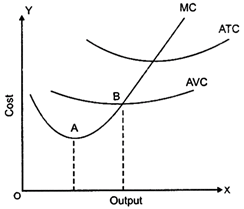
Relation between MC and AVC - (i) When AVC falls, MC < AVC or AVC falls only when MC < AVC. (Diagrammatically MC curve lies below AVC curve till their intersection) (ii) When AVC is minimum, MC = AVC or AVC is constant or minimum when MC = AVC (Diagrammatically the point where MC curve intersects AVC curve is the minimum point of AVC) (iii) When AVC rises, MC is more than AVC or AVC rises when MC > AVC. (Diagrammatically MC lies above AVC curve after intersecting AVC at its minimum point) Relation between MC and ATC (i) When AC (i.e., ATC) falls, MC < AC (ii) When AC is constant, MC = AC (iii) When AC rises, MC > AC


You need to login to perform this action.
You will be redirected in
3 sec

