A) isothermal
B) isobaric
C) irreversible
D) adiabatic
Correct Answer: B
Solution :
Indicator diagrams for isobaric process are given below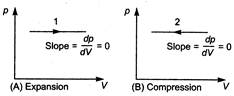 Graph 1. represents isobaric expansions, graph 2 represents isobaric compression.


You need to login to perform this action.
You will be redirected in
3 sec

