| t/s |
|
| 0 400 800 1200 1600 2000 2400 2800 3200 | 1.63 1.36 1.14 0.93 0.78 0.65 0.53 0.43 0.35 |
Answer:
The available data is
(i) The plot of [N2O5]
vessus time is as follows:
Time (s)
![]()
![]()
0
1.63
- 1.79
400
1.36
- 1.87
800
1.14
- 1.94
1200
0.93
- 2.03
1600
0.78
- 2.11
2000
0.64
- 2.19
2400
0.53
-2.28
2800
0.43
- 2.37
3200
0.35x 10⁻²
- 2.46
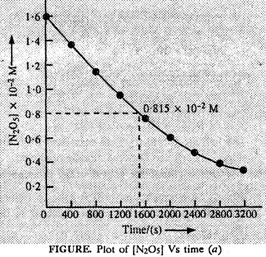
 (ii) Initial conc.
of N2O5 = 1.63 x 10?2M.
Half of initial
conc. = 1/2 x (1.63 x 10?2 M) = 0.815 x 10?2 M
Time corresponding
to half of initial concentraction (t/2) from the plot (a) = 1400 (s)
approximately
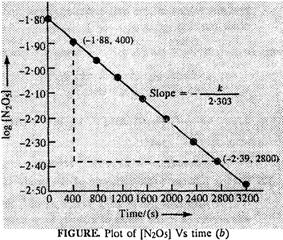
(iii) The graph of
log [N2O5] Vs. time has been plotted.
(iv) Since the
graph between log [N2O5] and time is a straight line the
reaction is of first order. The rate equation: rate (r) = k[N2O5]
(v) Slope of the
line
(ii) Initial conc.
of N2O5 = 1.63 x 10?2M.
Half of initial
conc. = 1/2 x (1.63 x 10?2 M) = 0.815 x 10?2 M
Time corresponding
to half of initial concentraction (t/2) from the plot (a) = 1400 (s)
approximately
(iii) The graph of
log [N2O5] Vs. time has been plotted.
(iv) Since the
graph between log [N2O5] and time is a straight line the
reaction is of first order. The rate equation: rate (r) = k[N2O5]
(v) Slope of the
line ![]()
![]() But slope
But slope ![]()
![]()
![]()
![]() (vi) Half life
period (t1/2)
(vi) Half life
period (t1/2) ![]()
![]() The half life
period (t1/2) as calculated from the slope is nearly the same as
already predicted.
The half life
period (t1/2) as calculated from the slope is nearly the same as
already predicted.


You need to login to perform this action.
You will be redirected in
3 sec

