|
|
0 | 20 | 40 | 60 | 80 |
|
|
0.0787 | 1.70 | 25.7 | 178 | 2140 |
Answer:
To draw the plot of
log K versus ![]() we can
re-write the given data as follows:
we can
re-write the given data as follows:
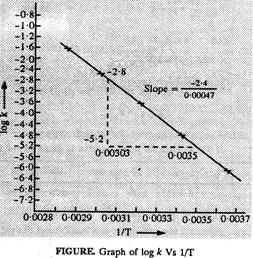
Draw the graph as
shown on the next page, From the graph, we find that
Slope
T (K)
1/T
log k
273
293
313
333
353
0.003663
0.003413
0.003194
0.003003
0.002833
-6.1040
-4.7696
-3.5900
-2.7496
-1.696
![]()
![]() Activation
energy,
Activation
energy,
![]()
![]() = 17,689 J mol?1
= 17.689 kJ mol?1.
As we know log k =
log
= 17,689 J mol?1
= 17.689 kJ mol?1.
As we know log k =
log ![]() (Compate it wity y
= mx + c which is equation of line in intercept form)
or log
(Compate it wity y
= mx + c which is equation of line in intercept form)
or log ![]() log A = value of
intercept on y-axis i.e., on the
log A = value of
intercept on y-axis i.e., on the
 k-axis.
= (?1 + 7.2) = 6.2 [y2
? y1] = ?1 (?7.2)]
Frequency factor, A
= antilog 6.2 = 1585000 = 1.585 x 10⁶ collisions s?1
The values of rate
constant k can be find from graph as follws :
k-axis.
= (?1 + 7.2) = 6.2 [y2
? y1] = ?1 (?7.2)]
Frequency factor, A
= antilog 6.2 = 1585000 = 1.585 x 10⁶ collisions s?1
The values of rate
constant k can be find from graph as follws :
T
1/T
Values of log k
(from graph)
Values of k
303
323
0.003300
0.003096
-4.2
-2.8
![]()
![]()


You need to login to perform this action.
You will be redirected in
3 sec

