Human Development-II
Category : 12th Class
Human Development
Sixty years ago, Rekha was born in a family of small farmer in Uttaranchal. She helped her mother in household chores. While her brothers went to school, she did not receive any education. She was dependent on her in laws after she was widowed immediately after marriage. She could not be economically independent and faced neglect. Her brother helped her to migrate to Delhi.
For the first time, she travelled by bus and train and was exposed to a large city like Delhi. After a while, the same city which attracted her with its buildings, roads, avenues and facilities and amenities disillusioned her.
With greater familiarity of the city, she could comprehend the paradoxes. The jhuggi and slum clusters, traffic jams, congestion, crimes, poverty, small children begging on traffic lights, people sleeping on footpaths, polluted water and air revealed another face of development. She used to think whether development and under-development coexist?
Whether development help some segments of population more than the other? Does development create haves and have nots? Let us examine these paradoxes and try to understand the phenomena.
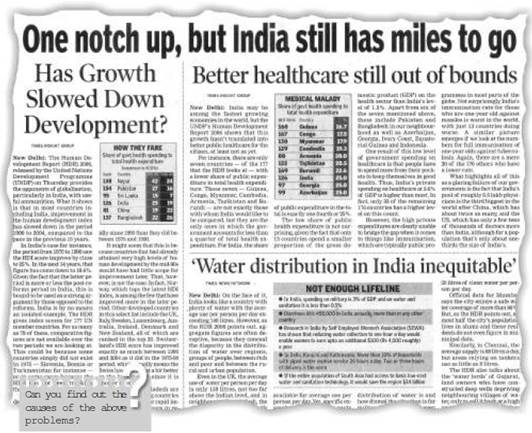
Of all the paradoxes of our times mentioned in the story, development is the most significant one. Development of a few regions, individuals brought about in a short span of time leads to poverty and malnutrition for many along with large scale ecological degradation. Is development class biased?
Apparently, it is believed that “Development is freedom” which is often associated with modernisation, leisure, comfort and affluence. In the present context, computerisation, industrialisation, efficient transport and communication network, large education system, advanced and modern medical facilities, safety and security of individuals, etc. are considered as the symbols of development. Every individual, community and government measures its performance or levels of development in relation to the availability and access to some of these things. But, this may be partial and one-sided view of development. It is often called the western or euro-centric view of development. For a development, make amendments and changes its indicators but also ranks all the countries postcolonial country like India, colonisation, marginalisation, social discrimination and regional disparity, etc. show the other face of development.
Thus, for India, development is a mixed bag of opportunities as well as neglect and deprivations. There are a few areas like the metropolitan centres and other developed enclaves that have all the modern facilities available to a small section of its population. At the other extreme of it, there are large rural areas and the slums in the urban areas that do not have basic amenities like potable water, education and health infrastructure available to majority of this population. The situation is more alarming if one looks at the distribution of the development opportunities among different sections of our society. It is a well-established fact that majority of the scheduled castes, scheduled tribes, landless agricultural labourers, poor farmers and slums dwellers, etc. are the most marginalised lot. A large segment of female population is the worst sufferers among all. It is also equally true that the relative as well as absolute conditions of the majority of these marginalised sections have worsened with the development happening over the years. Consequently, vast majority of people are compelled to live under abject poverty and subhuman conditions.
There is yet another inter-related aspect of development that has direct bearings on the deteriorating human conditions. It pertains to the environmental pollution leading to ecological crisis. Air, soil, water and noise pollutions have not only led to the ‘tragedy of commons’ but these have also threatened the existence of our society. Consequently, the poor are being subjected to three inter-related processes of declining capabilities; i.e. (1) social capabilities - due to displacement and weakening social ties (social capital), (2) environmental capabilities – due to pollution and, (3) personal capabilities - due to increasing incidence of diseases and accidents. This, in turn, has adverse effects on their quality of life and human development.
Based on the above experiences, it can be said that the present development has not been able to address the issues of social injustice, regional imbalances and environmental degradation. On the contrary, it is being widely considered as the prime cause of the social distributive injustices, deterioration in the quality of life and human development, ecological crisis and social unrest. Does development create, reinforce and perpetuate these crises? Thus, it was thought to take up human development as a separate issue against the prevalent western views of development which considers development as the remedy to all the ills including human development, regional disparities and environmental crisis.
Concerted efforts were made to look at development critically at various times in the past. But, most systematic effort towards this was the publication of the First Human Development Report by United Nations Development Programme (UNDP) in 1990. Since then, this organisation has been bringing out World Human Development Report every year. This report does not only define human development, make amendments and changes its indicators but also ranks all the countries of the world based on the calculated scores. According to the Human Development Report 1993, “progressive democratisation and increasing empowerment of people are seen as the minimum conditions for human development”. Moreover, it also mentions that “development must be woven around people, not the people around development” as was the case previously.
What is Human Development
“Human development is a process of enlarging the range of people’s choices, increasing their opportunities for education, health care, income and empowerment and covering the full range of human choices from a sound physical environment to economic, social and political freedom.”
Thus, enlarging the range of people’s choices is the most significant aspect of human development. People’s choices may involve a host of other issues, but, living a long and healthy life, to be educated and have access to resources needed for a decent standard of living including political freedom, guaranteed human rights and personal self-respect, etc. are considered some of the non-negotiable aspects of the human development.
You have already studied the concepts, indicators and approaches to human development and methods of calculating the index in your book, “Fundamentals of Human Geography.” In this chapter, let us try to understand the applicability of these concepts and indicators to India.
Human Development in India
India with a population of over 1.09 billion is ranked 127 among 172 countries of the world in terms of the Human Development Index (HDI). With the composite HDI value of O.602 India finds herself grouped with countries showing medium human development (UNDP 2005).
Table 3.1: Human Development Index Values of India and some other Countries
|
Country |
HDI Value |
Country |
HDI Value |
|
Norway |
0.963 |
Thailand |
0.778 |
|
Australia |
0.955 |
Sri Lanka |
0.751 |
|
Sweden |
0.949 |
Iran |
0.736 |
|
Switzerland |
0.947 |
Indonesia |
0.697 |
|
U.S.A. |
0.944 |
Egypt |
0.659 |
|
Japan |
0.943 |
India |
0.602 |
|
U.K. |
0.939 |
Myanmar |
0.578 |
|
France |
0.938 |
Pakistan |
0.527 |
|
Germany |
0.93 |
Nepal |
0.526 |
|
Argentina |
0.863 |
Bangladesh |
0.52 |
|
Cuba |
0.817 |
Kenya |
0.474 |
|
Russia |
0.795 |
Zambia |
0.394 |
|
Brazil |
0.792 |
Chad |
0.341 |
|
|
|
Niger |
0.281 |
Source: UNDP Human Development Report 2005, Oxford University Press. pp.219 - 222.
Low scores in the HDI is a matter of serious concern but, some reservations have been expressed about the approach as well as indicators selected to calculate the index values and ranking of the states/countries. Lack of sensitivity to the historical factors like colonisation, imperialism and neo-imperialism, socio-cultural factors like human rights violation, social discrimination on the basis of race, religion, gender and caste, social problems like crimes, terrorism, and war and political factors like nature of the state, forms of the government (democracy or dictatorship) level of empowerment are some factors that are very crucial in determining the nature of human development. These aspects have special significance in case of India and many other developing countries.
Using the indicators selected by the UNDP, the Planning Commission of India also prepared the Human Development Report for India. It used states and the Union Territories as the units of analysis. Subsequently, each state government also started preparing the state level Human Development Reports, using districts as the units of analysis. Although, the final HDI by the Planning Commission of India has been calculated by taking the three indicators as discussed in the book entitled, “Fundamentals of Human Geography”, yet, this report also discussed other indicators like economic attainment, social empowerment, social distributive justice, accessibility, hygiene and various welfare measures undertaken by the state. Some of the important indicators have been discussed in the following pages.
Indicators of Economic Attainments
Rich resource base and access to these resources by all, particularly the poor, down trodden and the marginalised is the key to productivity, well-being and human development. Gross National Product (GNP) and its per capita availability are taken as measures to assess the resource base/ endowment of any country. For India, it is estimated that its GDP was Rs. 3200 thousand crores (at current Price) and accordingly, per capita income was Rs. 20,813 at current prices. Apparently, these figures indicate an impressive performance but, prevalence of poverty, deprivation, malnutrition, illiteracy, various types of prejudices and above all social distributive injustices and large-scale regional disparities belie all the so-called economic achievements.
There are a few developed States like Maharashtra, Punjab, Haryana, Gujarat and Delhi that have per capita income more than Rs. 4,000 (figure at 1980-81 prices) per year and there are a large number of poorer States like Uttar Pradesh, Bihar, Orissa, Madhya Pradesh, Assam, Jammu and Kashmir, etc. which have recorded per capita income less than Rs. 2,000. Corresponding to these disparities, the developed states have higher per capita consumption expenditure as compared to the poorer states. It was estimated to be more than Rs. 690 per capita per month in States like Punjab, Haryana, Kerala, Maharashtra and Gujarat and below Rs. 520 per capita per month in States like Uttar Pradesh, Bihar, Orissa and Madhya Pradesh, etc. These variations are indicative of some other deepseated economic problems like poverty, unemployment and under-employment.
The disaggregated data of poverty for the states show that there are States like Orissa and Bihar which have recorded more than 40 per cent of their population living below the poverty line. The States of Madhya Pradesh, Sikkim, Assam, Tripura, Arunachal Pradesh, Meghalaya, Nagaland have more than 30 per cent of their population below poverty line. “Poverty is a state of deprivation. In absolute terms it reflects the inability of an individual to satisfy certain basic needs for a sustained, healthy and reasonably productive living.” Employment rate for educated youth is 25 per cent. Jobless growth and rampant unemployment are some of the important reasons for higher incidences of poverty in India.
Activity
Which one of the states in India has the highest proportion of population below poverty line?
Arrange the states on the basis of their percentage of population below poverty line in ascending order.
Select 10 states which have the high proportion of population below poverty line and represent the data by bar diagram.
Table 3.2: Poverty in India, 1999-2000
|
State |
% of Population below poverty line |
|
Andhra Pradesh |
15.77 |
|
Arunachal Pradesh |
33.47 |
|
Assam |
36.09 |
|
Bihar |
42.60 |
|
Goa |
4.40 |
|
Gujrat |
14.07 |
|
Haryana |
8.47 |
|
Himachal Pradesh |
7.63 |
|
West Bengal |
27.02 |
|
Andaman & Nicobar |
20.99 |
|
Chandigarh |
5.75 |
|
Jammu & Kashmir |
3.48 |
|
Karnataka |
20.04 |
|
Kerala |
12.72 |
|
Madhya Pradesh |
37.43 |
|
Maharashtra |
25.02 |
|
Manipur |
28.54 |
|
Meghalaya |
33.87 |
|
Mizoram |
19.47 |
|
Dadra & Nagar Haveli |
17.14 |
|
Daman & Diu |
4.44 |
|
Delhi |
8.23 |
|
Nagaland |
32.67 |
|
Orissa |
47.15 |
|
Punjab |
6.16 |
|
Rajasthan |
15.28 |
|
Sikkim |
36.55 |
|
Tamil Nadu |
21.12 |
|
Tripura |
34.44 |
|
Uttar Pradesh |
31.15 |
|
Lakshadweep |
15.60 |
|
Pondichery |
21.67 |
|
India |
26.10 |
Source: Planning Commission of India, (2001): India National Human Development Report, p.166
Indicators of a Healthy Life
Life free from illness and ailment and living a reasonably long life span are indicative of a healthy life. Availability of pre and post natal health care facilities in order to reduce infant mortality and post delivery deaths among mothers, old age health care, adequate nutrition and safety of individual are some important measures of a healthy and reasonably long life. India has done reasonably well in some of the health indicators like decline in death rate from 25.1 per thousand in 1951 to 8.1 per thousand in 1999 and infant mortality from 148 per thousand to 70 during the same period. Similarly, it also succeeded in increasing life expectancy at birth from 37.1 years to 62.3 years for males and 36.2 to 65.3 years for females from 1951 to 1999. Though, these are great achievements, a lot needs to be done. Similarly, it has also done reasonably well in bringing down birth rate from 40.8 to 26.1 during the same years, but it still is much higher than many developed countries.
The situation is more alarming when seen in the context of gender specific and rural and urban health indicators. India has recorded declining female sex ratio. The findings of 2001 Census of India are very disturbing particularly in case of child sex ratio between 0-6 age groups. The other significant features of the report are, with the exception of Kerala, the child sex ratio has declined in all the states and it is the most alarming in the developed state of Haryana and Punjab where it is below 800 female children per thousand male children. What factors are responsible for it? Is it the social attitude or scientific methods of sex-determination?
Indicators of Social Empowerment
“Development is freedom”. Freedom from hunger, poverty, servitude, bondage, ignorance, illiteracy and any other forms of domination is the key to human development. Freedom in real sense of the term is possible only with the empowerment and participation of the people in the exercise of their capabilities and choices in the society. Access to knowledge about the society and environment are fundamental to freedom. Literacy is the beginning of access to such a world of knowledge and freedom
Table 3.3: India Literacy Rates, 2001
|
State |
Total literacy |
Female literacy |
|
Andaman & Nicobar |
81.18 |
75.29 |
|
Andhra Pradesh |
61.11 |
51.17 |
|
Arunachal Pradesh |
54.74 |
44.24 |
|
Assam |
64.28 |
56.03 |
|
Bihar |
47.53 |
33.57 |
|
Chandigarh |
85.65 |
76.65 |
|
Chhattisgarh |
65.18 |
52.4 |
|
Dadra & Nagra Haveli |
60.03 |
42.99 |
|
Daman & Diu |
81.09 |
70.37 |
|
Delhi |
81.82 |
75 |
|
Goa |
82.32 |
75.51 |
|
Gujrat |
69.97 |
58.6 |
|
Haryana |
68.59 |
56.31 |
|
Himachal Pradesh |
77.13 |
68.08 |
|
Jammu & Kashmir |
54.46 |
41.82 |
|
Jharkhand |
54.13 |
39.38 |
|
Karnataka |
67.04 |
57.45 |
|
Kerala |
90.92 |
87.86 |
|
Lakshadweep |
90.92 |
81.56 |
|
Madhya Pradesh |
64.11 |
50.28 |
|
Maharashtra |
77.27 |
67.51 |
|
Manipur |
68.87 |
59.7 |
|
Meghalaya |
63.31 |
60.41 |
|
Mizoram |
88.49 |
86.13 |
|
Nagaland |
67.11 |
61.92 |
|
Orissa |
63.61 |
50.97 |
|
Pondicherry |
81.49 |
74.13 |
|
Punjab |
69.95 |
63.55 |
|
Rajasthan |
61.03 |
63.55 |
|
Sikkim |
61.03 |
61.46 |
|
Tamil Nadu |
73.47 |
64.55 |
|
Tripura |
73.66 |
65.41 |
|
Uttar Pradesh |
57.36 |
42.98 |
|
Uttaranchal |
72.28 |
60.26 |
|
West Bengal |
69.22 |
60.22 |
|
India |
65.38 |
54.16 |
Source: Census of India, 2001; Provisional Population Tables Series -1, p.142.
Activity
Represent the literacy rates for states having more than the national average by bar diagram after arranging the data in descending order.
Why is the total literacy rates in Kerala, Mizoram, Lakshadweep and Goa are higher than other states?
Can literacy reflect the status of Human Developments? Debate.
Table 3.3 showing the percentage of literates in India reveals some interesting features:
Apart from the spatial variations, percentage of literates in the rural areas and among the marginalised sections of our society such as females, scheduled castes, scheduled tribes, agricultural labourers, etc. is very low. It is worth mentioning here that though, there has been improvement in the percentage of literates among the marginalised section yet the gap between the richer and the marginalised sections of the population has increased over the years.
Human Development Index in India
In the backdrop of the above-mentioned important indicators the Planning Commission calculated the human development index by taking states and union territories as the unit of analysis.
Table 3.4: India – Human Development Index-2001
|
State |
HDI Value |
|
Andhra Pradesh |
0.416 |
|
Assam |
0.386 |
|
Bihar |
0.367 |
|
Gujrat |
0.479 |
|
Haryana |
0.509 |
|
Karnataka |
0.478 |
|
Kerala |
0.638 |
|
Madhya Pradesh |
0.394 |
|
Maharashtra |
0.523 |
|
Orissa |
0.404 |
|
Punjab |
0.537 |
|
Rajasthan |
0.424 |
|
Tamil Nadu |
0.531 |
|
Uttar Pradesh |
0.388 |
|
West Bengal |
0.472 |
Source: Planning Commission of India (2001): India
National Human Development Report 2001, p.25
India has been placed among the countries showing medium human development. What is the rank of India among the 172 countries of the world? As indicated in table 3.4 Kerala with the composite index value of 0.638 is placed at the top rank followed by Punjab (0.537), Tamil Nadu (0.531) Maharashtra (0.523) and Haryana (0.509). As expected, states like Bihar (0.367), Assam (0.386), Uttar Pradesh (0.388), Madhya Pradesh (0.394) and Orissa (0.404) are at the bottom among the 15 major states in India.
There are several socio-political, economic and historical reasons for such a state of affairs. Kerala is able to record the highest value in the HDI largely due to its impressive performance in achieving near hundred per cent literacy (90.92 per cent) in 2001. In a different scenario the states like Bihar, Madhya Pradesh, Orissa, Assam and Uttar Pradesh have very low literacy. For example, total literacy rate for Bihar was as low as 60.32 per cent during the same year. States showing higher total literacy rates have less gaps between the male and female literacy rates. For Kerala, it is 6.34 per cent, while it is 26.75 per cent in Bihar and 25.95 per cent in Madhya Pradesh.
Apart from the educational attainment, the levels of economic development too play significant impacts on HDI. Economically developed states like Maharashtra, Tamil Nadu and Punjab and Haryana have higher value of HDI as compared to states like Assam, Bihar, Madhya Pradesh, etc.
Regional distortions and social disparities which developed during the colonial period continue to play an important role in the Indian economy, polity and society. The Government of India has made concerted efforts to institutionalise the balanced development with its main focus on social distributive justice through planned development. It has made significant achievements in most of the fields but, these are still below the desired level.
Population, Environment and Development
Development in general and human development in particular is a complex concept used in social sciences. It is complex because for ages it was thought that development is a substantive concept and once it is achieved it will address all the socio-cultural and environmental ills of the society. Though, development has brought in significant improvement in the quality of life in more than one way but increasing regional disparities, social inequalities, discriminations, deprivations, displacement of people, abuse of human rights and undermining human values and environmental degradation have also increased.
Considering the gravity and sensitivity of the issues involved, the UNDP in its Human Development Report 1993, tried to amend some of the implicit biases and prejudices which were entrenched in the concept of development. People’s participation and their security were the major issues in the Human Development Report of 1993. It also emphasised on progressive democratisation and increasing empowerment of people as minimum conditions for human development. The report recognised greater constructive role of ‘Civil Societies’ in bringing about peace and human development. The civil society should work for building up opinion for reduction in the military expenditure, demobilisation of armed forces, transition from defence to production of basic goods and services and particularly disarmament and reduction in the nuclear warheads by the developed countries. In a nuclearised world, peace and well-being are major global concerns.
At the other extreme of this approach lie the views expressed by the Neo-Malthusians, environmentalists and radical ecologists. They believe that for a happy and peaceful social life proper balance between population and resources is a necessary condition. According to these thinkers, the gap between the resources and population has widened after eighteenth century. There have been marginal expansion in the resources of the world in the last three hundred years but there has been phenomenal growth in the human population. Development has only contributed in increasing the multiple uses of the limited resources of the world while there has been enormous increase in the demand for these resources. Therefore, the prime task before any development activity is to maintain parity between population and resources.
Scholar like Sir Robert Malthus was the first one to voice his concern about the growing scarcity of resources as compared to the human population. Apparently this argument looks logical and convincing, but a critical look will reveal certain intrinsic flaws such as resources are not a neutral category. It is not the availability of resources that is as important as their social distribution. Resources everywhere are unevenly distributed. Rich countries and people have access to large resource baskets while the poor find their resources shrinking. Moreover, unending pursuit for the control of more and more resources by the powerful and use of the same for exhibiting ones prowess is the prime cause of conflicts as well as the apparent contradictions between population resource and development.
Indian culture and civilisation have been very sensitive to the issues of population, resource and development for a long time. It would not be incorrect to say that the ancient scriptures were essentially concerned about the balance and harmony among the elements of nature. Mahatma Gandhi in the recent times advocated the reinforcement of the harmony and balance between the two. He was quite apprehensive about the on-going development particularly the way industrialisation has institutionalised the loss of morality, spirituality, self-reliance, non-violence and mutual cooperation and environment. In his opinion, austerity for individual, trusteeship of social wealth and non-violence are the key to attain higher goals in the life of an individual as well as that of a nation. His views were also re-echoed in the Club of Rome Report “Limits to Growth” (1972), Schumacher’s book “Small is Beautiful” (1974), Brundtland Commission’s Report “Our Common Future” (1987) and finally in the “Agenda-21 Report of the Rio Conference” (1993).
Exercises
1. Choose the right answers of the following from the given options.
(i) Which one of the following is India’s rank in terms of Human Development Index among the countries of the world in 2005?
(a) 126 (c) 128
(b) 127 (d) 129
(ii) Which one of the following states of India has the highest rank in the Human Development Index?
(a) Tamil Nadu (c) Kerala
(b) Punjab (d) Haryana
(iii) Which one of the following states of India has the lowest female literacy?
(a) Jamu and Kashmir (c) Jharkhand
(b) Arunachal Pradesh (d) Bihar
(iv) Which one of the following states of India has the lowest female child sex ratio 0-6 years?
(a) Gujarat (c) Punjab
(b) Haryana (d) Himachal Pradesh
(v) Which one of the following Union Territories of India has the highest literacy rate?
(a) Lakshadweep (c) Daman and Diu
(b) Chandigarh (d) Andaman and Nicobar Islands
2. Answer the following questions in about 30 words.
(i) Define Human Development.
(ii) Give two reasons for low levels of Human Development in most of the Northern States of India.
(iii) Give two reasons for declining child sex ratio in India.
3. Answer the following questions in about 150 words.
(i) Discuss the spatial patterns of female literacy in India in 2001 and bring out the reasons responsible for it.
(ii) Which factors have caused spatial variations in the levels of Human Development among the 15 major states in India?


You need to login to perform this action.
You will be redirected in
3 sec

