Data Handling
Category : 7th Class
Data Handling
Learning Objectives
Data Collection
Data collection is important as it helps us to collect, study and record information, make decisions about important issues as well as to pass Information on to others. It enables us to provide information regarding a specific topic or area of study.
The data that are collected need to be organised in a proper table, so that it becomes easy to understand and interpret.
Lets understand some important terms:
Mean =\[\frac{\sum{fixi}}{\sum{fi}}\]. (where f is frequency and x is variable).
For example, to find the mode of 9, 11, 3, 44, 17, 11, 17, 15, 15, 15, 27, 40, 8
Put the numbers in increasing order as shown below:
3, 8, 9, 15, 15, 15, 17, 17, 17, 17, 27, 40, 44
The number which occur most frequently is the mode. In the given data, the mode is 17 which occurs the most at 4 times.
Median = \[{{\left( \frac{n+1}{2} \right)}^{th}}\]observation
When observations are arranged in an increasing order.
When the totals of the list are even, the median is equal to the sum of the two middle (after sorting the list into increasing order) numbers divided by two.
If a set of n observations is given, where n is even, then
Median = \[\frac{{{\left( \frac{n}{2} \right)}^{th}}observation+{{\left( \frac{n}{2}+1 \right)}^{th}}observation}{2}\]
When observations are arranged in increasing order.
Example
The mean, median, mode and range for the following list of values are:
8, 9, 10, 10, 10, 11, 11, 11, 11, 13
(a) 10.5, 10.5, 10, 11 (b) 10.5, 10.4, 10, 5
(c) 10.4, 10.5, 11, 5 (d) 10.5, 10.4, 11, 11
(e) None of these
Ans. (c)
Explanation: The mean is the usual average.
\[\therefore \,\,\,\,Mean\,\,\,=\,\,\,\frac{\left( 8\text{ }+\text{ }9\text{ }+\text{ }10\text{ }+\text{ }10\text{ }+\text{ }10\text{ }+\text{ }11\text{ }+\text{ }11\text{ }+\text{ }11\text{ }+\text{ }11\text{ }+\text{ }13 \right)}{10}\,\,\,\,=\,\,\,\frac{104}{10}\,\,\,=\,\,10.4\]
The list contains 10 observations, so the median is given by
Median = \[\frac{{{\left( \frac{n}{2} \right)}^{th}}observation+{{\left( \frac{n}{2}+1 \right)}^{th}}observation}{2}\]
\[\frac{{{5}^{th}}\,observation\,\,+\,\,{{6}^{th}}\,\,observation}{2}\,\,\,=\,\,\,\frac{10+11}{2}\,\,\,=\,\,\,\frac{21}{2}\,\,\,=10.5\]
The mode is the number repeated most often. In this list, 11 is repeated four times.
Thus, mode = 11.
The largest value is 13 and the smallest is 8. Thus, the range is \[13 - 8 = 5\].
Graphical Representation of Data
Data can be represented as bar graph, double bar graph, pie chart etc.
The angle of a section\[=\frac{data\,corresponding\,to\,the\,\sec tion}{sum\,of\,data}\times 360{}^\circ =\frac{{{x}_{i}}}{\sum{{{x}_{i}}}}\times 360{}^\circ .\]
The result of a survey of 20 persons about the movie they like is given below. Which bar graph represent the data correctly?
Comedy Action Romance Drama Science Fiction
4 5 6 1 4
(a) 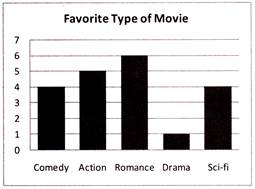
(b) 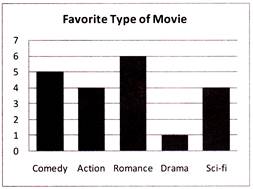
(c) 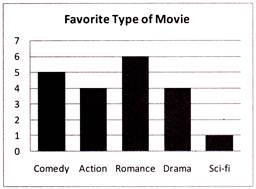
(d) 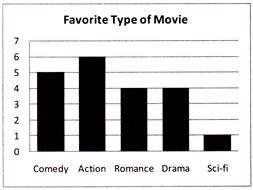
(e) None of these
Ans. (a)
Probability
It is the branch of mathematics that studies the possible outcomes of given events together with the outcomes’ relative likelihoods and distributions. In general, probability is a measure of the likeliness that an event will occur.
\[P\left( E \right)=\frac{n(E)}{n(S)}\] where E = expected or favourable outcomes
n(E) = Number of expected or favourable outcomes
n(S) = Number of total outcomes.
Example
In a box, there are 8 red, 7 blue and 6 green balls. One ball is picked up randomly. What is the probability that it is neither red nor green?
(a) \[\frac{1}{3}\] (b) \[\frac{3}{4}\]
(c) \[\frac{7}{19}\] (d) \[\frac{8}{21}\]
(e) \[\frac{9}{21}\]
Ans. (a)
Explanation: Total number of balls = (8 + 7 + 6 = 21).
Let E = event that the ball drawn is neither red nor green = event that the ball drawn is blue.
n(E) = 7.
\[\therefore \,\,\,\,P(E)\,\,\,\,=\frac{n(E)}{n(S)}\,\,\,=\,\,\,\frac{7}{21}\,\,\,=\,\,\,\frac{1}{3}\]
Tickets numbered 1 to 20 are mixed up and then a ticket is drawn at random. What is the probability that the ticket drawn has a number which is a multiple of 3 or 5?
(a) \[\frac{1}{2}\] (b) \[\frac{2}{5}\]
(c) \[\frac{8}{15}\] (d) \[\frac{9}{20}\]
(e) None of these
Ans. (d)
Explanation: Here, S = {1, 2, 3, 4, ....... 19, 20}.
Let E = event of getting a multiple of 3 or 5 = {3, 6, 9, 12, 15, 18, 5, 10, 20}
\[\therefore \,\,\,P(E)\,\,\,=\frac{n(E)}{n(S)}\,\,\,=\frac{9}{20}\].


You need to login to perform this action.
You will be redirected in
3 sec

