NCERT Extracts - The World Population Distribution, Density and Growth
Category : UPSC
World Population
- The population of the world is unevenly distributed.
- The remark of George B. Cressey about the population of Asia that "Asia has many places where people are few and few place where people are very many" is true about the pattern of population distribution of the world also.
- Broadly, 90 per cent of the world population lives in about 10 per cent of its land area.
Natural Growth of Population
- This is the population increased by difference between births and deaths in a particular region between two points of time.
- Natural Growth = Births - Deaths
- Actual Growth of Population: This is Births - Deaths + In Migration - Out Migration
Positive Growth of Population
- This happens when the birth rate is more than the death rate between two points of time or when people from other countries migrate permanently to a region.
Negative Growth of Population
- If the population decreases between two points of time it is known as negative growth of population.
- It occurs when the birth rate falls below the death rate or people migrate to other countries.
- The crude birth rate (CBR) is expressed as number of live births in a year per thousand of population.
- CDR is expressed in terms of number of deaths in a particular year per thousand of population in a particular region.
Migration
- Apart from birth and death there is another way by which the population size changes.
- When people move from one place to another, the place they move from is called the Place of Origin and the place they move to is called the Place of Destination.
- The place of origin shows a decrease in population while the population increases in the place of destination.
- Migration may be interpreted as a spontaneous effort to achieve a better balance between population and resources. In the first century A.D. it was below 300 million.
- The expanding world trade during the sixteenth and seventeenth century, set the stage for rapid population growth.
- Around 1750, at the dawn of the Industrial Revolution, the world population was 550 million.
- World population exploded in the eighteenth century after the Industrial Revolution.
- Technological advancement achieved so far helped in the reduction of birth rate and provided a stage for accelerated population growth.
- It took more than a million years for the human population to attain the one billion mark. But it took only 12 years for it to rise from 5 billion to 6 billion.
- The ratio between the number of women and men in the population is called the Sex Ratio.
- In India, the sex ratio is worked out using the formula: more women in the population does not mean they have a better status. It could be that the men might have migrated to other areas for employment.
- Females have a biological advantage over males as they tend to be more resilient than males yet this advantage is cancelled out by the social disadvantages and discriminations that they face.
Age Structure
- Age structure represents the number of people of different age groups.
- This is an important indicator of population composition, since a large size of population in the age group of 15-59 indicates a large working population.
- A greater proportion of population above 60 years represents an ageing population which requires more expenditure on health care facilities.
- Similarly high proportion of young population would mean that the region has a high birth rate and the population is youthful.
Age-Sex Pyramid
- The age-sex structure of a population refers to the number of females and males in different age groups.
- A population pyramid is used to show the age-sex structure of the population.
- The shape of the population pyramid reflects the characteristics of the population. The left side shows the percentage of males while the right side shows the percentage of women in each age group.
Expanding Populations
- The age-sex pyramid of Nigeria is a triangular shaped pyramid with a wide base and is typical of less developed countries.
- These have larger populations in lower age groups due to high birth rates.
- If you construct the pyramids for Bangladesh and Mexico, it would look the same.
Constant Population
- Australia's age-sex pyramid is bell shaped and tapered towards the top. This shows birth and death rates are almost equal leading to a near constant population.
Declining Populations
- The Japan pyramid has a narrow base and a tapered top showing low birth and death rates. The population growth in developed countries is usually zero or negative.
Ageing Population
- Population ageing is the process by which the share of the older population becomes proportionally larger. This is a new phenomenon of the twentieth century.
- In most of the developed countries of the world, population in higher age groups has increased due to increased life expectancy.
- With a reduction in birth rates, the proportion of children in the population has declined.
- In general terms rural areas are those where people are engaged in primary activities and urban areas are those when majority of the working population is engaged in non-primary activities.
Literacy
- In India, literacy rate denotes the percentage of population above 7 years of age, who is able to read, write and have the ability to do arithmetic calculations with understanding.
Occupational Structure
- The working population (i.e. women and men of the age group - 15 to 59)
- Agriculture, forestry, fishing and mining are classified as primary activities manufacturing as secondary, transport, communication and other services as tertiary and the jobs related to research and developing ideas as quaternary activities.
Demographic Transition
- Demographic transition theory can be used to describe and predict the future population of any area.
- The theory tells us that population of any region changes from high births and high deaths to low births and low deaths as society progresses from rural agrarian and illiterate to urban industrial and literate society.
- These changes occur in stages which are collectively known as the demographic cycle.
- The first stage has high fertility and high mortality because people reproduce more to compensate for the deaths due to epidemics and variable food supply.
- The population growth is slow and most of the people are engaged in agriculture, where large families are an asset.
- Life expectancy is low, people are mostly illiterate and have low levels of technology.
- Two hundred years ago all the countries of the world were in this stage.
- Fertility remains high in the beginning of second stage but it declines with time.
- This is accompanied by reduced mortality rate.
- Improvements in sanitation and health conditions lead to decline in mortality.
- Because of this gap the net addition to population is high.
- In the last stage, both fertility and mortality decline considerably.
- The population is either stable or grows slowly. The population becomes urbanised,
- literate and has high technical knowhow and deliberately controls the family size.
- This shows that human beings are extremely flexible and are able to adjust their fertility.
- Thomas Malthus in his theory (1793) stated that the number of people would increase faster than the food supply.
- Any further increase would result in a population crash caused by famine, disease and war.
- The preventive checks are better than the physical checks. For the sustainability of our resources, the world will have to control the rapid population increase.
Human Settlements
- The census of India, 1991 defines urban settlements as "All places which have municipality, corporation, cantonment board or notified town area committee and have a minimum population of 5,000 persons, at least 75 per cent of male workers are engaged in non- agricultural pursuits and a density of population of at least 400 persons per square kilometers are urban.
Types And Patterns of Settlements
- Compact or Nucleated settlements
- These settlements are those in which large number of houses are built very close to each other.
- Such settlements develop along river valleys and in fertile plains. Communities are closely knit and share common occupations.
- Dispersed Settlements
- In these settlements, houses are spaced far apart and often interspersed with fields.
- A cultural feature such as a place of worship or a market, binds the settlement together.
- In loess areas of China, cave dwellings were important and African Savanna's building materials were mud bricks and the Eskimos, in Polar Regions, use ice blocks to construct igloos.
Types of Urban Settlements
- Town
- The concept of 'town' can best be understood with reference to 'village'.
- Population size is not the only criterion. Functional contrasts between towns and villages may not always be clear cut, but specific functions such as, manufacturing, retail and wholesale trade, and professional services exist in towns.
- City
- A city may be regarded as a leading town, which has outstripped its local or regional rivals. In the words of Lewis Mumford, "the city is in fact the physical form of the highest and most complex type of associative life".
- Cities are much larger than towns and have a greater number of economic functions.
- They tend to have transport terminals, major financial institutions and regional administrative offices.
- When the population crosses the one million mark it is designated as a million city.
- Conurbation
- The term conurbation was coined by Patrick Geddes in 1915 and applied to a large area of urban development that resulted from the merging of originally separate towns or cities.
- Greater London, Manchester, Chicago and Tokyo are examples.
- Megalopolis
- This Greek word meaning "great city", was popularised by Jean Gottman (1957) and signifies 'super-metropolitan' region extending, as union of conurbations.
- The urban landscape stretching from Boston in the north to south of Washington in U.S.A. is the best known example of a megalopolis.
Population in India
- Population data are collected through Census operation held every 10 years in our country.
- The first population Census in India was conducted in 1872 but its first complete Census was conducted only in 1881.
Growth of Population
- Population growth has two components namely; natural and induced. While the natural growth is analysed by assessing the crude birth and death rates, the induced components are explained by the volume of inward and outward movement of people in any given area.
- The annual growth rate of India's population is 1.64 per cent (2011).
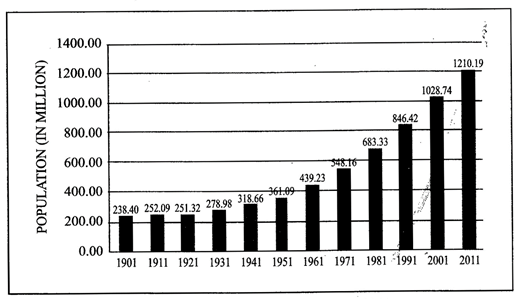
India's Population 1901-2011
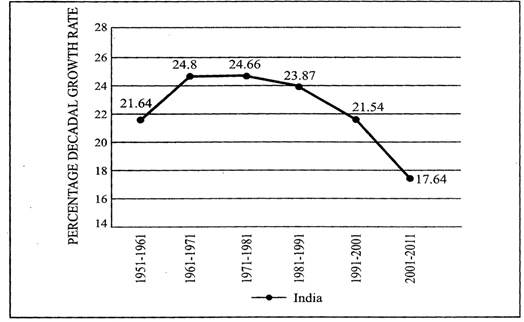
India's population Growth Rates during 1951-2011
- The growth rate of population in India over the last one century has been caused by annual birth rate and death rate and rate of migration and thereby shows different trends.
- There are four distinct phases of growth identified within this period:
- The period from 1901-1921 is referred to as a period of stagnant or stationary phase of growth of India's population, since in this period growth rate was very low, even recording a negative growth rate during 1911-1921.
- Both the birth rate and death rate were high keeping the rate of increase low. Poor health and medical services, illiteracy of people at large and inefficient distribution system of food and other basic necessities were largely responsible for a high birth and death rates in this period.
- The decades 1921-1951 are referred to as the period of steady population growth.
- An overall improvement in health and sanitation throughout the country brought down the mortality rate. At the same time better transport and communication system improved distribution system.
- The crude birth rate remained high in this period leading to higher growth rate than the previous phase. This is impressive at the backdrop of Great Economic Depression, 1920s and World War II.
- The decades 1951-1981 are referred to as the period of population explosion in India, which was caused by a rapid fall in the mortality rate but a high fertility rate of population in the country.
- The average annual growth rate was as high as 2.2 per cent.
- It is in this period, after the Independence, that developmental activities were introduced through a centralised planning process and economy started showing up ensuring the improvement of living condition of people at large.
- Consequently, there was a high natural increase and higher growth rate. Besides, increased international migration bringing in Tibetans, Bangladeshis, Nepalies and even people from Pakistan contributed to the high growth rate.
- In the post 1981 till present, the growth rate of country's population though remained high, has started slowing down gradually.
- A downward trend of crude birth rate is held responsible for such a population growth.
- This was, in turn, affected by an increase in the mean age at marriage, improved quality of life particularly education of females in the country.
- The growth rate of population is, however, still high in the country, and it has been projected by World Development Report that population of India will touch 1,350 million by 2025.
Migration
- Migrations is the movement of people in and out of an area.
- Actually migration was recorded beginning from the first Census of India conducted –in 1881. This data were recorded on the basis of place of birth.
- However, the first major modification was introduced in 1961 Census by bringing in two additional components viz; place of birth i.e. village or town and duration of residence (if born elsewhere).
- Further in 1971, additional information on place of last residence and duration of stay at the place of enumeration were incorporated. Information on reasons for migration were incorporated in 1981 Census and modified in consecutive Censuses.
- Migration is another way by which population size changes. People may move within a country or between countries. Emigrants are people who leave a country; Immigrants are those who arrive in a country.
Causes of Migration
- People, generally are emotionally attached to their place of birth. But millions of people leave their places of birth and residence. There could be variety of reasons.
- These reasons can be put into two broad categories:
- push factor, these cause people to leave their place of residence of origin; and
- pull factors, which attract the people from different places.
- In India people migrate from rural to urban areas mainly due to poverty, high population pressure on the land, lack of basic infrastructural facilities like health care, education, etc.
- Apart from these factors, natural disasters such as, flood, drought, cyclonic storms, earthquake, tsunami, wars and local conflicts also give extra push to migrate.
- On the other hand, there are pull factors which attract people from rural areas to cities.
- The most important pull factor for majority of the rural migrants to urban areas is the better opportunities, availability of regular work and relatively higher wages.
- Better opportunities for education, better health facilities and sources of entertainment, etc. are also quite important pull factors.
- It can be seen that reason for migration of males and females are different.
- For example, work and employment have remained the main cause for male migration 38 per cent while it is only three per cent for the females.
- Contrary to this, about 65 per cent of females move out from their parental houses following their marriage.
- This is the most important cause in the rural areas of India except in Meghalaya where reverse is the case.
Consequences of Migration
- Migration is a response to the uneven distribution of opportunities over space. People tend to move from place of low opportunity and low safety to the place of higher opportunity and better safety.
- This, in turn, creates both benefits and problems for the areas, people migrate from and migrate to. Consequences can be observed in economic, social, cultural, political and demographic terms.
- Economic Consequences
- A major benefit for the source region is the remittance sent by migrants. Remittances from the international migrants are one of the major sources of foreign exchange.
- Demographic Consequences
- Migration leads to the redistribution of the population within a country.
- Rural urban migration is one of the important factors contributing to the population growth of cities.
- Age and skill selective out migration from the rural area have adverse effect on the rural demographic structure.
- Social Consequences
- Migrants act as agents of social change. The new ideas related to new technologies, family planning, girl's education, etc. get diffused from urban to rural areas through them.
- Migration leads to intermixing of people from diverse cultures.
- Environmental Consequences
- Overcrowding of people due to rural-urban migration has put pressure on the existing social and physical infrastructure in the urban areas.
- This ultimately leads to unplanned growth of urban settlement and formation of slums shanty colonies.
- Apart from this, due to over-exploitation of natural resources, cities are facing the acute problem of depletion of ground water, air pollution, disposal of sewage and management of solid wastes.
Others
- Migration of 'women' either for education or employment enhances their autonomy and role in the economy but also increases their vulnerability.
- If remittances are the major benefits of migration from the point of view of the source region, the loss of human resources particularly highly skilled people is the most serious cost.
- The market for advanced skills has become truly a global market and the most dynamic industrial economies are admitting and recruiting significant proportions of the highly trained professionals from poor regions. Consequently, the existing underdevelopment in the source region gets reinforced.
Some Important Facts
- Births are usually measured using the birth rate i.e. the number of live births per 1,000 people.
- Deaths are usually measured using the death rate i.e. the number of deaths per 1,000 people.
- Births and deaths are the natural causes of population change. The difference between the birth rate and the death rate of a country is called the natural growth rate.
- The population increase in the world is mainly due to rapid increase in natural growth rate.
- Immigration: Migrants who move into a new place are called Immigrants.
- Emigration: Migrants who move out of a place are called Emigrants.
- Physiological density = total population/ net cultivated area
- Agricultural density = total agricultural population/net cultivable area
- Agricultural population includes cultivators and agricultural labourers and their family members.
- Main Worker is a person who works for at least 183 days (or six months) in a year.
- Marginal Worker is a person who works for less than 183 days (or six months) in a year.
|
Table : India's Sex Ratio 1901 - 2011
|
|
Census Year
|
Sex ratio (Females per 1000 males)
|
|
1901
|
972
|
|
1911
|
961
|
|
1921
|
955
|
|
1931
|
950
|
|
1941
|
945
|
|
1951
|
946
|
|
1961
|
941
|
|
1971
|
930
|
|
1981
|
934
|
|
1991
|
927
|
|
2001
|
933
|
|
2011
|
940
|
|
Table : India Literacy Rates, 2011
|
|
State
|
Total Literacy
|
Female Literacy
|
|
India
|
74.04%
|
65.46%
|
|
Jammu and Kashmir
|
68.74
|
58.01
|
|
Himachal Pradesh
|
83.78
|
76.60
|
|
Punjab
|
76.68
|
71.34
|
|
Chandigarh-
|
86.43
|
81.38
|
|
Uttarakhand
|
79.63
|
70.70
|
|
Haryana
|
76.64
|
66.77
|
|
NCT of Delhi-
|
86.34
|
80.93
|
|
Rajasthan
|
67.06
|
52.66
|
|
Uttar Pradesh
|
69.72
|
59.26
|
|
Bihar
|
63.82
|
53.33
|
|
Sikkim
|
82.20
|
76.43
|
|
Arunachal Pradesh
|
66.95
|
59.57
|
|
Nagaland
|
80.11
|
76.69
|
|
Manipur
|
79.85
|
73.17
|
|
Mizoram
|
91.58
|
89.40
|
|
Tripura
|
87.75
|
83.15
|
|
Meghalaya
|
75.48
|
73.78
|
|
Assam
|
73.18
|
67.27
|
|
West Bengal
|
77.08
|
71.16
|
|
Jharkhand
|
67.63
|
56.21
|
|
Odisha
|
73.45
|
64.36
|
|
Chhattisgarh
|
71.04
|
60.59
|
|
Madhya Pradesh
|
70.63
|
60.02
|
|
Gujarat
|
79.31
|
70.73
|
|
Daman & Diu
|
87.07
|
79.59
|
|
Dadra and Nagar Haveli
|
77.65
|
65.93
|
|
Maharashtra
|
82.91
|
75.48
|
|
Andhra Pradesh
|
67.66
|
59.74
|
|
Karnataka
|
75.60
|
68.13
|
|
Goa
|
87.40
|
81.84
|
|
Lakshadweep
|
92.28
|
88.25
|
|
Kerala
|
93.91
|
91.98
|
|
Tamil Nadu
|
80.33
|
73.86
|
|
Puduchhery
|
86.55
|
81.22
|
|
Andaman & Nicobar Islands
|
86.27
|
81.84
|


