Directions: The bar graph provided below represents the production of Rice and Wheat in different states of a country in the certain year. Answer questions based on the bar graph. 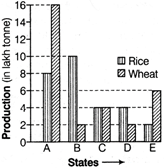 |
A) A
B) B
C) C
D) D
Correct Answer: B
Solution :
[b] From the given bar diagram, it is clear that state B is the largest producer of Rice.


You need to login to perform this action.
You will be redirected in
3 sec

