Directions: The bar graph provided below represents the production of Rice and Wheat in different states of a country in the certain year. Answer questions based on the bar graph. 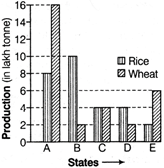 |
A) 5.5
B) 5.6
C) 5.7
D) 5.8
Correct Answer: B
Solution :
| [b] Average production of Rice \[=\frac{\text{Total}\,\,\text{production}\,\,\text{of}\,\,\text{Rice}}{\text{Number}\,\,\text{of}\,\,\text{states}}\] \[=\frac{28}{5}=5.6\] lakh tonne |


You need to login to perform this action.
You will be redirected in
3 sec

