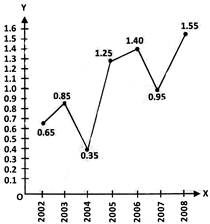
 In how many years were the exports more than the imports?
A) \[1\]
B) \[2\]
C) \[3\]
D) \[4\]
Correct Answer: D
Solution :
Not Available


You need to login to perform this action.
You will be redirected in
3 sec

