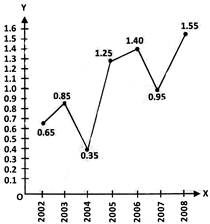
 The imports of the company in 2003 was \[Rs.\,272\] crores. How much was the exports from the company in 2003?
A) \[Rs.\,370\] crores
B) \[Rs.\,320\] crores
C) \[Rs.\,280\] crores
D) \[Rs.\,275\] crores
Correct Answer: B
Solution :
Not Available


You need to login to perform this action.
You will be redirected in
3 sec

