A) first increases then decreases
B) Continuously decreases
C) Continuously increases
D) First decreases then increases
Correct Answer: B
Solution :
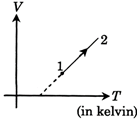
[B] V = KT + C \[P=\frac{nRT}{V}\]\[\Rightarrow P=\frac{mRT}{KT+C}\] \[\frac{dP}{dT}=\frac{nRC}{{{(KT+C)}^{2}}}\] As \[C<0\] by diagram \[\Rightarrow \frac{dP}{dT}<0\]for all T \[\Rightarrow P\]continuously decreases.


You need to login to perform this action.
You will be redirected in
3 sec

