| Direction: Study the pie-chart and line graph to answer the question. |
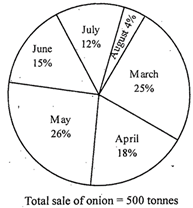
| The pie-chart Shows the percentage sales of onion in different months. |
 |
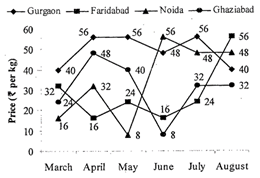
| The line graph shows the price of onion in different months in different cities |
 |
A) Rs.1600000
B) Rs.1700000
C) Rs. 1500000
D) Rs.1300000
E) Rs. 1400000
Correct Answer: E
Solution :
Total sales in March \[=500\times \frac{25}{100}=125\]tonnes Total sales in Faridabad in March\[\therefore \]\[=500\times \frac{25}{100}=125\,\]tonnes \[\therefore \]Its total cost\[=43.75\times 1000\times 32=\]Rs.1400000


You need to login to perform this action.
You will be redirected in
3 sec

