| Direction: Study the pie-chart and line graph to answer the question. |
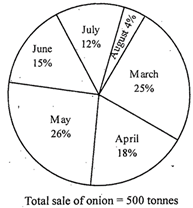
| The pie-chart Shows the percentage sales of onion in different months. |
 |
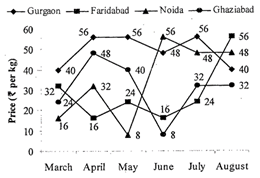
| The line graph shows the price of onion in different months in different cities |
 |
A) 700%
B) 600%
C) 500%
D) 400%
E) 300%
Correct Answer: A
Solution :
Price of onion in April in Gurgaon =Rs.56 per kg Price of Onion in Noida in May = Rs.8 per kg \[\therefore \]Reqd% \[=\frac{56\times 100}{8}=700%\]


You need to login to perform this action.
You will be redirected in
3 sec

