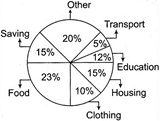
| Direction: The circle graph given here shows the spendings a family on various items during the year 2010. Study the graph and answer, the questions. |
| Per cent of money spent by a family on various items during 2010 |
 |
A) 5 : 2
B) 2 : 5
C) 4 : 5
D) 5 : 4
Correct Answer: D
Solution :
\[\frac{\text{Expenditure on Housing}}{\text{Expenditure on Education}}\] \[=\frac{15%}{12%}=\frac{15}{12}=\frac{5}{4}=5:4\]


You need to login to perform this action.
You will be redirected in
3 sec

