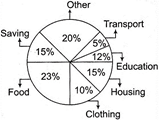
| Direction: The circle graph given here shows the spendings a family on various items during the year 2010. Study the graph and answer, the questions. |
| Per cent of money spent by a family on various items during 2010 |
 |
A) Food
B) Housing
C) Clothing
D) Others
Correct Answer: A
Solution :
Maximum expenditure is 23% and it is on Food.


You need to login to perform this action.
You will be redirected in
3 sec

