| Direction for question: Study the following Pie-chart carefully and answer the questions given below. |
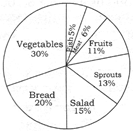
| Statistics of a Survey on the food item's preference of the people, conducted on a sample of 30,000 people. |
 |
A) \[48%\]
B) \[35%\]
C) \[46%\]
D) \[37%\]
Correct Answer: D
Solution :
People preferring fruits over vegetables \[=\frac{11}{30}\times 100=\underline{\mathbf{37%}}\]


You need to login to perform this action.
You will be redirected in
3 sec

