| Direction for question: Study the following Pie-chart carefully and answer the questions given below. |
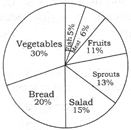
| Statistics of a Survey on the food item's preference of the people, conducted on a sample of 30,000 people. |
 |
A) \[1600\]
B) \[1800\]
C) \[1500\]
D) \[1400\]
Correct Answer: C
Solution :
People preferring fish \[=30000\times \frac{5}{100}=\underline{\mathbf{1500}}\]


You need to login to perform this action.
You will be redirected in
3 sec

