Data Handling
Category : 3rd Class
Data Handling
Introduction
Pictograph is referred as the representation of data in picture form. In ancient time pictograph was the method for writing the information. Numbers were also represented in picture form.
Pictograph and Its Use
Information about anything in the form of picture is called pictograph. There are different types of graphs which are used for the representation of data. These are bar graph, line graph, venn diagram.
A picture of a house ![]() represents one house.
represents one house.
Pictures of two house ![]() represent 2 house,
represent 2 house,
If one picture of a house ![]() represents 6 houses then
represents 6 houses then
the pictures of 2 houses ![]() will represent 6 \[\times \] 2 = 12 houses.
will represent 6 \[\times \] 2 = 12 houses.
Cricket match played by Australia during the year 1998: ![]()
Cricket match played by India during the year 1998:
![]()
Cricket match played by South Africa during the year 1998: ![]() Which one country played maximum match during the year 1998?
Which one country played maximum match during the year 1998?
(a) India (b) Australia
(c) South Africa (d) All of these
(e) None of these
Ans. (a)
Explanation: There are more balls in front of India.
How many animals are there in a forest if![]() = 1000 animals and total animals in the forest is represented by
= 1000 animals and total animals in the forest is represented by![]() ?
?
(a) 5000 (b) 4000
(c) 6000 (d) 7000
(e) None of these
Ans. (b)
Explanation: Total animals = 1000 \[\times \] 4 = 4000.
Representation of Information Using Pictograph
Following are the distribution of students in different sections in a school:
|
Sections |
Number of students |
|
A |
60 |
|
B |
75 |
|
C |
45 |
|
D |
30 |
Representation of above information in picture form is as follows:
Scale: 15 boys = ![]()
|
Sections |
Number of students |
|
A |
|
|
B |
|
|
C |
|
|
D |
|
From the above pictograph following information is obtained:
There are 15 \[\times \]4 = 60 students in section A,
15 \[\times \] 5 = 75 students are there in section B,
15 \[\times \] 3 = 45 students are there in section C,
15 \[\times \] 2 = 30 students are there in section D,
A pond has following fishes:
![]()
What is the total fishes in the pond if ![]() = 100
= 100
(a) 500 (b) 900
(c) 700 (d) 800
(e) None of these
Ans. (c)
Explanation: 1 fish represents 100 fishes, so total fishes = 100 \[\times \] 7 = 700.
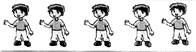
There are 30 students in class 2 and 40 students in class 3. A teacher represents the above information as follows:
Total students in class 2 = 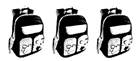
Total students in class 3 = 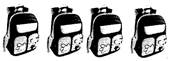
How many students are represented by a symbol of![]() ?
?
(a) 10 (b) 20
(c) 30 (d) 40
(e) None of these
Ans. (a)
Explanation: 3 bags represents 30 students so 1 bag represents 10 students.


You need to login to perform this action.
You will be redirected in
3 sec