
Pictograph
Category : 4th Class
 Pictograph
When the data is represented on the graph with the help of pictures the graph is known as Pictograph. Let's understand how to make the pictograph. Number of cycles sold by a shop in a week has been shown in the following table:
| Day | Number of Cycles |
| Monday | 20 |
| Tuesday | 25 |
| Wednesday | 15 |
| Thursday | 20 |
| Friday | 30 |
| Saturday | 25 |
Let us make a pictograph using above information:
Step 1: Choose a symbol to represent cycles here we choose
Step 2: Now choose a convenient scale in order to easily preparing the pictograph. Like one represents 5 cycles
Thus, the number of cycles sold by the shop on Monday

Number of cycles sold by the shop on Tuesday

Number of cycles sold by the shop on Wednesday
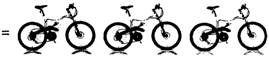
Number of cycles sold by the shop on Thursday

Number of cycles sold by the shop on Friday

Number of cycles sold by the shop on Saturday

Now arrange them in the table as below.
| Monday |  |
| Tuesday |  |
| Wednesday |  |
| Thursday |  |
| Friday |  |
| Saturday |  |
One represents 5 cycles

Number of vultures which died because of diseases in different years has been shown is the following table.
| 2005 |  |
| 2006 |  |
| 2007 |  |
| 2008 |  |
| 2009 |  |
| 2010 |  |
One represents 1000 vultures
Read the above given pictograph and answer the following questions:
(a) In which year does the maximum number of vultures died
(b) How many vultures was died in 2009
(c) How many more vultures was died in 2007 in comparison of 2010
(d) Find the total number of vultures which died during the year 2006 to 2010
(e) In which year 2000 vultures was died
Explanations
(a) Pictograph shows maximum number of  in 2007. Therefore, 2007 is the year in which maximum number of vultures was died.
(b) There are 3  in 2009. Thus \[\text{3}\times \text{1}000\]\[=\text{3}000\]vultures was died in 2009.
(c) Number of vultures which died in the year \[\text{2}00\text{7}=\text{6}\times \text{1}000=\text{6}000\] Number of vultures which died in the year \[\text{2}0\text{1}0=\text{2}\times \text{1}000=\text{2}000\] Difference\[=\text{6}000\text{2}000=\text{4}000\] Thus 4000 more vultures was died in 2007 in comparison of 2010.
(d) Total number of which has been shown in the table during 2006 to 2010 is 19. Thus total number of vultures which died during 2006 to \[\text{2}0\text{1}0=1\text{9}\times \text{1}000=\text{19}000\]
(e) \[\text{2}000\div \text{1}000=\text{2}\]
There are 2  In the year 2010. So it is 2010 when 2000 vultures were died.






You need to login to perform this action.
You will be redirected in
3 sec