-
question_answer1)
Direction: The graph shows the number of rubber bands each child has.  |
Who has the greatest number of rubber bands?
A)
Chandra done
clear
B)
Leena done
clear
C)
Girish done
clear
D)
Mohan done
clear
View Solution play_arrow
-
question_answer2)
Direction: The graph shows the number of rubber bands each child has.  |
How many rubber bands must Leena give to Mohan so that they have the same number of rubber bands?
A)
3 done
clear
B)
0 done
clear
C)
6 done
clear
D)
9 done
clear
View Solution play_arrow
-
question_answer3)
Direction: The graph shows the number of rubber bands each child has.  |
Girish gives all his rubber bands to Leena, Mohan and Chandra so that all of them have the same number of rubber bands. How many rubber bands would each of them have at last?
A)
26 done
clear
B)
27 done
clear
C)
28 done
clear
D)
24 done
clear
View Solution play_arrow
-
question_answer4)
| Direction: The graph shows the number of rubber bands each child has. |
How many more rubber bands do Leena and Mohan together have than Chandra and Girish together?
A)
3 done
clear
B)
39 done
clear
C)
6 done
clear
D)
42 done
clear
View Solution play_arrow
-
question_answer5)
Direction: The graph shows the number of rubber bands each child has. 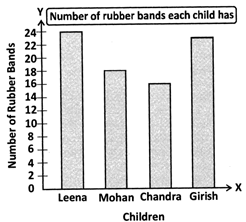 |
Which of the following is the correct ascending order of children with regard to the number of rubber bands they have?
A)
Leena, Girish, Mohan, Chandra done
clear
B)
Chandra, Mohan, Girish, Leena done
clear
C)
Leena, Mohan, Chandra, Girish done
clear
D)
Chandra, Mohan, Leena, Girish done
clear
View Solution play_arrow
-
question_answer6)
Direction: The bar graph shows the number of pupils in a class taking part in a mathematics competition over five years. 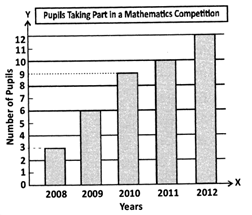 |
How many pupils took part in the competition over the five years?
A)
31 done
clear
B)
50 done
clear
C)
40 done
clear
D)
45 done
clear
View Solution play_arrow
-
question_answer7)
| Direction: The bar graph shows the number of pupils in a class taking part in a mathematics competition over five years. |
How many more pupils took part in the competition in 2012 than in 2010?
A)
6 done
clear
B)
3 done
clear
C)
4 done
clear
D)
2 done
clear
View Solution play_arrow
-
question_answer8)
Direction: The bar graph shows the number of pupils in a class taking part in a mathematics competition over five years.  |
What is the increase in the number of participants from 2009 to 2011?
A)
4 done
clear
B)
1 done
clear
C)
3 done
clear
D)
0 done
clear
View Solution play_arrow
-
question_answer9)
| Direction: The bar graph shows the number of pupils in a class taking part in a mathematics competition over five years. |
In 2012, if each participant pays Rs. 25 as participation fee, how much money is collected?
A)
Rs. 325 done
clear
B)
Rs. 275 done
clear
C)
Rs. 300 done
clear
D)
Rs. 500 done
clear
View Solution play_arrow
-
question_answer10)
| Direction: The bar graph shows the number of pupils in a class taking part in a mathematics competition over five years. |
What amount is collected over the five given years if the same fee of Rs. 30 per pupil is charged?
A)
Rs. 1800 done
clear
B)
Rs. 1200 done
clear
C)
Rs. 6000 done
clear
D)
Rs. 2400 done
clear
View Solution play_arrow
-
question_answer11)
Direction: The bar graph shows the number of fruits sold by a grocer on different days.  |
How many more fruits did the grocer sell on Friday than on Tuesday?
A)
30 done
clear
B)
28 done
clear
C)
35 done
clear
D)
40 done
clear
View Solution play_arrow
-
question_answer12)
Direction: The bar graph shows the number of fruits sold by a grocer on different days. 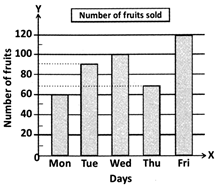 |
On which days did the grocer sell fewer than 100 fruits?
A)
Monday, Tuesday and Wednesday done
clear
B)
Monday, Tuesday and Thursday done
clear
C)
Monday, Thursday and Friday done
clear
D)
Wednesday, Thursday and Friday done
clear
View Solution play_arrow
-
question_answer13)
| Direction: The bar graph shows the number of fruits sold by a grocer on different days. |
On which day was the sale of fruits double that on Monday?
A)
Friday done
clear
B)
Tuesday done
clear
C)
Wednesday done
clear
D)
Thursday done
clear
View Solution play_arrow
-
question_answer14)
A)
280 done
clear
B)
300 done
clear
C)
200 done
clear
D)
275 done
clear
View Solution play_arrow
-
question_answer15)
A)
Rs. 5800 done
clear
B)
Rs. 6000 done
clear
C)
Rs. 2750 done
clear
D)
Rs. 5500 done
clear
View Solution play_arrow
-
question_answer16)
A)
61 done
clear
B)
600 done
clear
C)
3250 done
clear
D)
6000 done
clear
View Solution play_arrow
-
question_answer17)
A)
Rs. 131106 thousands done
clear
B)
Rs. 113160 thousands done
clear
C)
Rs. 131160 thousands done
clear
D)
Rs. 131016 thousands done
clear
View Solution play_arrow
-
question_answer18)
A)
Week 4, week 5 done
clear
B)
Week 1, week 2 done
clear
C)
Week 2, week 3 done
clear
D)
Week 3, week 4 done
clear
View Solution play_arrow
-
question_answer19)
Which of the following is the ascending order of the weeks based on the sales of the vehicles?
A)
Week 2, week 3, week 1, week 4, week 5 done
clear
B)
Week 5, week 3, week 1, week 4, week 2 done
clear
C)
Week 4, week 2, week 1, week 3, week 5 done
clear
D)
Week 2, week 1, week 4, week 5, week 3 done
clear
View Solution play_arrow
-
question_answer20)
A)
640 done
clear
B)
490 done
clear
C)
69 done
clear
D)
960 done
clear
View Solution play_arrow
-
question_answer21)
A)
Rs. 12750 done
clear
B)
Rs. 16000 done
clear
C)
Rs. 15720 done
clear
D)
Rs. 16250 done
clear
View Solution play_arrow
-
question_answer22)
A)
190 done
clear
B)
180 done
clear
C)
160 done
clear
D)
120 done
clear
View Solution play_arrow
-
question_answer23)
A)
\[\frac{26}{29}\] done
clear
B)
\[\frac{13}{64}\] done
clear
C)
\[\frac{13}{32}\] done
clear
D)
\[\frac{26}{32}\] done
clear
View Solution play_arrow
-
question_answer24)
A)
10 a.m.- 12 noon done
clear
B)
2p.m.- 4p.m. done
clear
C)
4 p.m. - 6 p.m. done
clear
D)
12 noon-2 p.m. done
clear
View Solution play_arrow
-
question_answer25)
A)
40 done
clear
B)
1 done
clear
C)
20 done
clear
D)
60 done
clear
View Solution play_arrow
-
question_answer26)
A)
180 done
clear
B)
190 done
clear
C)
140 done
clear
D)
160 done
clear
View Solution play_arrow
-
question_answer27)
Direction: The bar graph shows the no. of boys and girls enrolled in four tuition centres.  |
What would the total number of students enrolled be at tuition centre P, if 46 more students want to enrol in it?
A)
346 done
clear
B)
356 done
clear
C)
296 done
clear
D)
256 done
clear
View Solution play_arrow
-
question_answer28)
Direction: The bar graph shows the no. of boys and girls enrolled in four tuition centres. 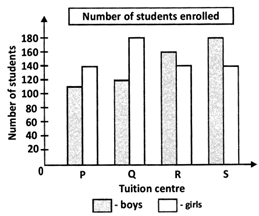 |
The oldest tuition centre has the maximum students enrolled and the latest one has the minimum students enrolled. Which is the latest tuition centre?
A)
Q done
clear
B)
P done
clear
C)
S done
clear
D)
R done
clear
View Solution play_arrow
-
question_answer29)
| Direction: The bar graph shows the no. of boys and girls enrolled in four tuition centres. |
Which tuition centre has 50 more boys enrolled than those in tuition centre P?
A)
Q done
clear
B)
R done
clear
C)
S done
clear
D)
Both Q & R done
clear
View Solution play_arrow
-
question_answer30)
A)
Wednesday and Thursday done
clear
B)
Thursday and Friday done
clear
C)
Wednesday and Friday done
clear
D)
Thursday and Saturday done
clear
View Solution play_arrow
-
question_answer31)
A)
Rs. 30 done
clear
B)
Rs. 70 done
clear
C)
Rs. 20 done
clear
D)
Rs. 90 done
clear
View Solution play_arrow
-
question_answer32)
A)
Rs. 24 done
clear
B)
Rs. 46 done
clear
C)
Rs. 50 done
clear
D)
Rs. 56 done
clear
View Solution play_arrow
-
question_answer33)
A)
5 done
clear
B)
6 done
clear
C)
\[7\frac{1}{2}\] done
clear
D)
\[5\frac{1}{2}\] done
clear
View Solution play_arrow
-
question_answer34)
A)
Rs. 320 done
clear
B)
Rs. 160 done
clear
C)
Rs. 610 done
clear
D)
Rs. 480 done
clear
View Solution play_arrow
-
question_answer35)
Direction: The bar graph shows the monthly salary of five friends. 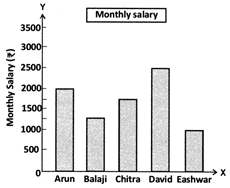 |
Balaji spent Rs. 690 of his salary. How much of his salary is left?
A)
Rs. 550 done
clear
B)
Rs. 650 done
clear
C)
Rs. 600 done
clear
D)
Rs. 560 done
clear
View Solution play_arrow
-
question_answer36)
Direction: The bar graph shows the monthly salary of five friends.  |
By how much is Arun?s salary more than that of Chitra?
A)
Rs. 1750 done
clear
B)
Rs. 250 done
clear
C)
Rs. 500 done
clear
D)
Rs. 750 done
clear
View Solution play_arrow
-
question_answer37)
| Direction: The bar graph shows the monthly salary of five friends. |
Each month, David spends half of his salary on food, clothes and conveyance. He gives Rs. 780 to his parents and saves the rest. What is David's savings in each month?
A)
Rs. 370 done
clear
B)
Rs. 740 done
clear
C)
Rs. 470 done
clear
D)
Rs. 570 done
clear
View Solution play_arrow
-
question_answer38)
| Direction: The bar graph shows the monthly salary of five friends. |
By how much is Eashwar's salary less than that of Chitra?
A)
Rs. 750 done
clear
B)
Rs. 1000 done
clear
C)
Rs. 1750 done
clear
D)
Rs. 2750 done
clear
View Solution play_arrow
-
question_answer39)
Direction: The circle chart shows the favourite hobbies of 120 students of class 4. 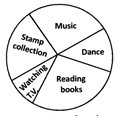 |
Twice the number of students who like stamp collection like reading books. If 40 students like reading books, how many of them like to collect stamps?
A)
80 done
clear
B)
60 done
clear
C)
40 done
clear
D)
20 done
clear
View Solution play_arrow
-
question_answer40)
| Direction: The circle chart shows the favourite hobbies of 120 students of class 4. |
\[\frac{1}{3}\]of the students like music and dance. How many students like dance, if 14 of them like music?
A)
26 done
clear
B)
14 done
clear
C)
40 done
clear
D)
54 done
clear
View Solution play_arrow
-
question_answer41)
Direction: The circle chart shows the favourite hobbies of 120 students of class 4.  |
26 students like to dance. \[\frac{1}{2}\] the no. of students who like to dance, like to watch T.V. How many students like to watch T.V.?
A)
39 done
clear
B)
13 done
clear
C)
52 done
clear
D)
26 done
clear
View Solution play_arrow
-
question_answer42)
| Direction: The circle chart shows the favourite hobbies of 120 students of class 4. |
If \[\frac{1}{5}\] of the total number of students like music, how many students like music?
A)
80 done
clear
B)
120 done
clear
C)
40 done
clear
D)
24 done
clear
View Solution play_arrow
-
question_answer43)
Direction: The circle graph shows the difference modes of conveyance of the children of a certain school. 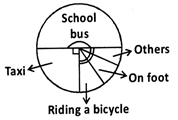 |
What fraction of the children come to school by school bus?
A)
\[1\frac{1}{2}\] done
clear
B)
\[\frac{1}{2}\] done
clear
C)
\[\frac{1}{8}\] done
clear
D)
\[\frac{1}{4}\] done
clear
View Solution play_arrow
-
question_answer44)
| Direction: The circle graph shows the difference modes of conveyance of the children of a certain school. |
If there are 800 students in the school, how many go to school by taxi?
A)
400 done
clear
B)
600 done
clear
C)
200 done
clear
D)
100 done
clear
View Solution play_arrow
-
question_answer45)
| Direction: The circle graph shows the difference modes of conveyance of the children of a certain school. |
How many students go to school on foot if there are 1200 students in the school?
A)
600 done
clear
B)
800 done
clear
C)
100 done
clear
D)
1200 done
clear
View Solution play_arrow
-
question_answer46)
| Direction: The circle graph shows the difference modes of conveyance of the children of a certain school. |
If the school has 1600 students, how many of them use modes of conveyance other than school bus and taxi?
A)
1600 done
clear
B)
800 done
clear
C)
400 done
clear
D)
1200 done
clear
View Solution play_arrow
-
question_answer47)
Direction: Observe the given graph.  Answer the following questions based on the graph. Answer the following questions based on the graph. |
A full session at a certain school starts at 8 a.m. and ends at 4 p.m. How many hours are allotted for arts during the session?
A)
45 minutes done
clear
B)
30 minutes done
clear
C)
15 minutes done
clear
D)
1 hour done
clear
View Solution play_arrow
-
question_answer48)
Direction: Observe the given graph.  Answer the following questions based on the graph. Answer the following questions based on the graph. |
On Saturdays, the school functions from 8 a.m. to 12 noon. For how many minutes can the students play on a Saturday?
A)
1 hour done
clear
B)
15 minutes done
clear
C)
30 minutes done
clear
D)
20 minutes done
clear
View Solution play_arrow
-
question_answer49)
How many hours are the classes held each day at the school from Monday to Friday?
A)
2 hours done
clear
B)
6 hours done
clear
C)
4 hours done
clear
D)
12 hours done
clear
View Solution play_arrow
-
question_answer50)
If 4 different games are to be played during the sports / games time on a normal day, what is the duration of each game?
A)
40 minutes done
clear
B)
30 minutes done
clear
C)
45 minutes done
clear
D)
15 minutes done
clear
View Solution play_arrow
-
question_answer51)
If \[\frac{1}{2}\]an hour is spent by the students in the library, which day of the week is it?
A)
Saturday done
clear
B)
Wednesday done
clear
C)
Friday done
clear
D)
Monday done
clear
View Solution play_arrow


