 done
clear
done
clear
 done
clear
done
clear
 done
clear
done
clear
 done
clear
done
clear
 done
clear
done
clear
 done
clear
done
clear
 done
clear
done
clear
 done
clear
done
clear
 done
clear
done
clear
 done
clear
done
clear
 done
clear
done
clear
 done
clear
done
clear
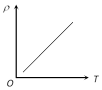
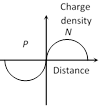
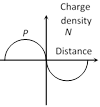
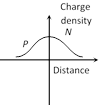
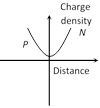
question_answer5) The curve between charge density and distance near P-N junction will be
 done
clear
done
clear
 done
clear
done
clear
 done
clear
done
clear
 done
clear
done
clear
 done
clear
done
clear
 done
clear
done
clear
 done
clear
done
clear
 done
clear
done
clear
 done
clear
done
clear
 done
clear
done
clear
 done
clear
done
clear
 done
clear
done
clear
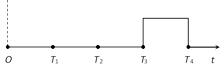
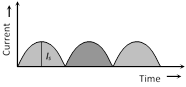
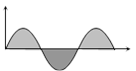
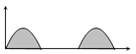
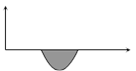
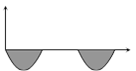
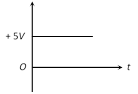
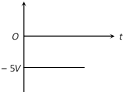
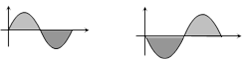
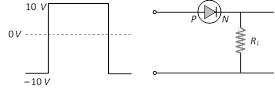
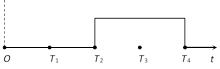
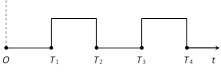
question_answer13) In a negative logic the following wave form corresponds to the 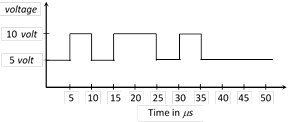
 done
clear
done
clear
 done
clear
done
clear
 done
clear
done
clear
 done
clear
done
clear
 done
clear
done
clear
 done
clear
done
clear
 done
clear
done
clear
 done
clear
done
clear
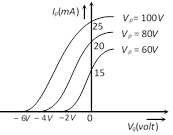
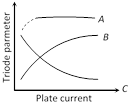
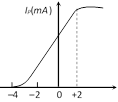
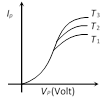
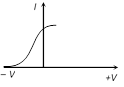
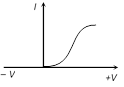
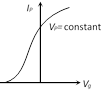
question_answer18) The mutual characteristic of triode is
 done
clear
done
clear
 done
clear
done
clear
 done
clear
done
clear
 done
clear
done
clear
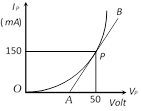
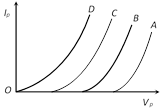
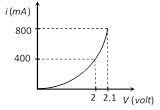
question_answer19) The value of amplification factor from the following graph will be 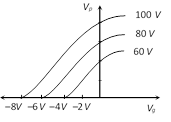
 done
clear
done
clear
 done
clear
done
clear
 done
clear
done
clear
 done
clear
done
clear
 done
clear
done
clear
 done
clear
done
clear
 done
clear
done
clear
 done
clear
done
clear
 done
clear
done
clear
 done
clear
done
clear
 done
clear
done
clear
 done
clear
done
clear


You need to login to perform this action.
You will be redirected in
3 sec


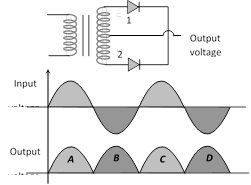 The contribution to output voltage from diode ? 2 is [MP PMT 2001]
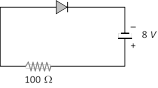
 (Y)
(Y)