0
question_answer1) The graph AB shown in figure is a plot of temperature of a body in degree celsius and degree Fahrenheit. Then
question_answer2) The graph shows the variation of temperature (T) of one kilogram of a material with the heat (H) supplied to it. At O, the substance is in the solid state. From the graph, we can conclude that
question_answer3) A block of ice at ?10°C is slowly heated and converted to steam at 100°C. Which of the following curves represents the phenomenon qualitatively [IIT-JEE (Screening) 2000]
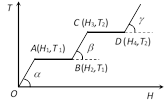
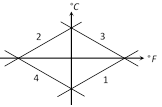
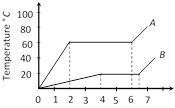
question_answer4) The portion AB of the indicator diagram representing the state of matter denotes
question_answer5) The figure given below shows the cooling curve of pure wax material after heating. It cools from A to B and solidifies along BD. If L and C are respective values of latent heat and the specific heat of the liquid wax, the ratio L/C is
question_answer6) A solid substance is at 30°C. To this substance heat energy is supplied at a constant rate. Then temperature versus time graph is as shown in the figure. The substance is in liquid state for the portion (of the graph) [RPET 1990, 94]
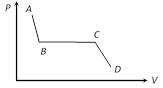
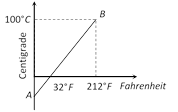
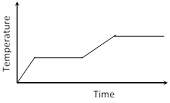
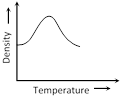
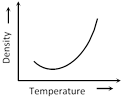
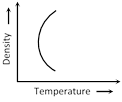
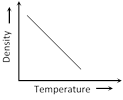
question_answer7) The variation of density of water with temperature is represented by the
question_answer8) If a graph is plotted taking the temperature in Fahrenheit along Y-axis and the corresponding temperature in Celsius along the X-axis, it will be a straight line [AIIMS 1997]
question_answer9) Which of the curves in figure represents the relation between Celsius and Fahrenheit temperatures
question_answer10) Heat is supplied to a certain homogenous sample of matter, at a uniform rate. Its temperature is plotted against time, as shown. Which of the following conclusions can be drawn
question_answer11) A student takes 50gm wax (specific heat = 0.6 kcal/kg°C) and heats it till it boils. The graph between temperature and time is as follows. Heat supplied to the wax per minute and boiling point are respectively [BHU 1994]
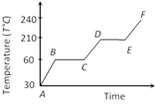
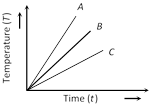
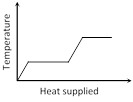
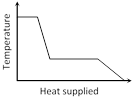
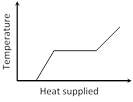
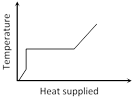
question_answer12) The graph signifies [JIPMER 1999]
question_answer13) Which of the substances A, B or C has the highest specific heat ? The temperature vs time graph is shown
question_answer14) Two substances A and B of equal mass m are heated at uniform rate of 6 cal s?1 under similar conditions. A graph between temperature and time is shown in figure. Ratio of heat absorbed \[{{H}_{A}}/{{H}_{B}}\] by them for complete fusion is
Please Wait you are being redirected....
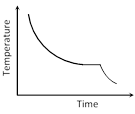
You need to login to perform this action.You will be redirected in 3 sec
OTP has been sent to your mobile number and is valid for one hour
Your mobile number is verified.