 done
clear
done
clear
 done
clear
done
clear
 done
clear
done
clear
 done
clear
done
clear
 done
clear
done
clear
 done
clear
done
clear
 done
clear
done
clear
 done
clear
done
clear
 done
clear
done
clear
 done
clear
done
clear
 done
clear
done
clear
 done
clear
done
clear
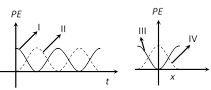 I, III done
clear
I, III done
clear
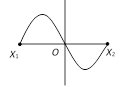
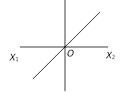
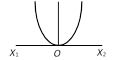
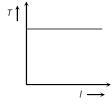
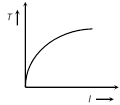
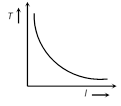
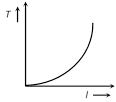
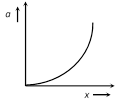
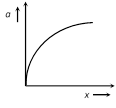
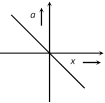
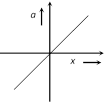
question_answer10) For a simple pendulum the graph between L and T will be. [CPMT 1992]
 done
clear
done
clear
 done
clear
done
clear
 done
clear
done
clear
 done
clear
done
clear
 done
clear
done
clear
 done
clear
done
clear
 done
clear
done
clear
 done
clear
done
clear
 done
clear
done
clear
 done
clear
done
clear
 done
clear
done
clear
 done
clear
done
clear
 done
clear
done
clear
 done
clear
done
clear
 done
clear
done
clear
 done
clear
done
clear


You need to login to perform this action.
You will be redirected in
3 sec