Category : 7th Class
Data Handling
Modern society is information oriented. Every person wants numeric information of different fields of the society like the marks obtained in a particular subject by the students, five year plans etc. Statistics is a branch of mathematics which deals with the process, analyzing and interpreting the data.
Terms Related to Data
Example:
The runs scored by 11 members of a cricket team are as follows.
34, 0, 25, 34, 67, 73, 67, 1, 0, 34, 71.
Arrange the above data using tally marks.
Solution:
|
Scores |
Tally Mark |
Frequency |
|
0 |
II |
2 |
|
1 |
I |
1 |
|
25 |
I |
1 |
|
34 |
III |
3 |
|
67 |
II |
2 |
|
71 |
I |
1 |
|
73 |
I |
1 |
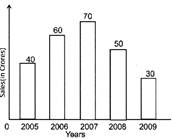
Example: The total sales of a company (in crores) in different years are as follows.
|
Years |
2005 |
2006 |
2007 |
2008 |
2009 |
|
Sales (in Crores) |
40 |
60 |
70 |
50 |
30 |
Present the above data in the form of a bar graph.
Solution:
Mean
Mean is defined as the ratio of sum of observations to total number of observations.
\[Mean=\frac{Sum\,of\,observations}{Total\,number\,of\,observations}\]
Example:
Find the mean of first five even natural numbers.
Solution: First five even natural numbers are 2, 4, 6, 8,10
From the above formula, we get
Mean\[=\frac{2+4+6+8+10}{5}=\frac{30}{5}=6\]


You need to login to perform this action.
You will be redirected in
3 sec

