Category : Banking
Microsoft Office
Microsoft Office is an office suite of desktop applications, servers and services for Microsoft Windows and OS X operating systems. It was first announced by Bill Gates of Microsoft on 1 August 1988 at COMDEX in Las Vegas.
BASICS OF MICROSOFT WORD
Microsoft Word is the word processor component of Microsoft Office that allows users the ability to create and save documents. A word document can be a letter, report, or even a web page.
How to Start the MS Word Program
Click Start.\[\to \]All Programs\[\to \]Microsoft Office\[\to \]Microsoft Word
File format for document created in word is .docx or.doc
GENERATIONS OF MICROSOFT OFFIFCE

SOME IMPORTANT MICROSOFT TERMINOLOGY
Microsoft Outlook
Its is a personal information manager from Microsoft, available as a part of the Microsoft Office suite. Although often used mainly as an email application, it also includes a calendar, task manager, contact manager, note taking, journal, and web browsing.
It can be used as a stand-alone application, or can work with Microsoft Exchange Server and Microsoft SharePoint Server for multiple users in an organization, such as shared mailboxes and calendars, Exchange public folders, SharePoint lists, and meeting schedules.
Microsoft OneNote
Microsoft OneNote was included in all Microsoft Office offerings before eventually becoming completely free of charge. OneNote is available as a web application on Office Online, a Windows desktop app, a mobile app for Windows Phone, iOS, Android, and Symbian, and a Metro-style app for Windows 8 or later.
Microsoft OneNote is a freeware note-taking program. It gathers notes (handwritten or typed), drawings, screen clipping-sand audio commentaries. However, OneNote eventually became a core component of Microsoft Office; with the release of Microsoft Office 2013.
Microsoft Office Sway
Microsoft office Sway released by Microsoft in August 2015, Sways is stored on Microsoft's server and are tied to the user's Microsoft account. They can be viewed and edited from any web browser with a web app available in Office Online. They can also be accessed using apps for Windows 10 and iOS. Additional apps are currently in development for Android and Windows 10 Mobile.
Microsoft office, Sway allows users who have a Microsoft account to combine text and media to create a presentable website. Users can pull content locally from the device in use, or from internet sources such as. Bing, Facebook, One-Drive, and YouTube.
Microsoft Office 2010
Microsoft Office 2010 (code named Office 14) is a version of the Microsoft Office productivity suite for Microsoft Windows.
It is the successor to Microsoft Office 2007 and the predecessor to Microsoft Office 2013. Office 2010 includes extended file format support, user interface improvements, and a changed user experience.
A 64-bit version of Office 2010 is available, but not for Windows XP or Windows Server 2003. It is the first version of the productivity suite to ship in both 32-bit and 64-bit versions.
Office 2010 marks the debut of Office Web Apps, online versions of Word, Excel, PowerPoint, and OneNote that work in web browsers. Office Starter 2010, a new edition of Office, replaced the low-end home productivity software, Microsoft Works.
Office 2010 is the first version to require product activation for volume licensing editions. Unlike previous versions of the productivity suite, every application in Office 2010 features the ribbon as its user primary user interface. Mainstream support ended on October 13, 2015; extended support ends on October 13, 2020.
PARTS OF WORD WINDOW

It is located in upper left button comer of the office.
The options available in the Office Button menu are:
|
New |
Creates a new document |
|
Open |
Opens an existing document form disk |
|
Save |
Saves the open document to disk |
|
Save As |
Saves the open document to disk under a different name |
|
|
Prints the open document |
|
Prepare |
Prepares the document for distribution, through such tasks as adding a signature on encryption |
|
Send |
Sends the document to another user by email or fax |
|
Publish |
Makes the document publicly available via a document serve or a public web space |
|
Close |
Exits the open document. |
The Ribbon is located at the top of the screen and stretches across the window. The Ribbon is organized into 8 different
Tabs; File, Home, Insert, Page Lausert, References, Mailings, Review, and View. Each Tab has several Groups, where similar tools and features are found.
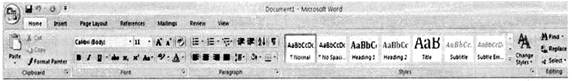
(a) HOME TAB
The Home tab displays a variety of tools and features used to format and move text. The Home tab can change the color, size, font, and alignment of the text. The Home tab can also cut, copy, and paste text. The Home tab has 5 groups; Clipboard, Font, Paragraph, Styles and Editing.
(b) INSERT TAB
The Insert tab displays tools and features used to add an item or special format to the document. The Insert tab can add pictures, symbols, or page numbers to the document. The Insert tab has 7 groups; Pages, Tables, Illustrations, Links, Header & Footer, Text, and Symbols.

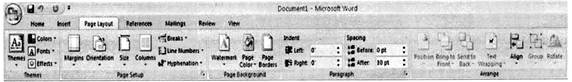
(c) PAGE LAYOUT TAB
The Page Layout tab displays tools and features used to change the way text and images will be positioned in the document. The Page Lausert tab controls the margins and page orientation. The Page Lausert tab has 5 groups; Themes, Page Setup, Page Background, Paragraph, and Arrange.
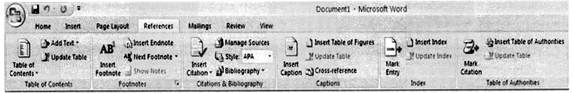
(d) REFERENCE TAB
The References tab displays tools and features used in academic or professional writing. The References tab will assist with using citations, footnotes, and a table of contents. The References tab has 6 groups; Table of Contents, Footnotes, Citations, Captions, Index, and Table of Authorities.
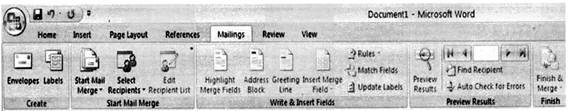
(e) MAILINGS TAB
The Mailings tab displays tools and features used to print envelopes, labels, and send mass communications. The Mailings tab has 5 groups; Create, Start Mail Merge, Write & Insert Fields, Preview Results, and Finish.
(f) REVIEW TAB
The Review tab displays tools and features used to fix mistakes or write drafts of a document. The Review tab can check spelling and grammar, add comments to a section of the document, or change the language of the document. The Review tab has 7 groups; Proofing, Language, Comments, Tracking, Changes, Compare, and Protect.

(g) VIEW TAB
The View tab displays tools and features to change the way the document looks on the screen. The View tab can change the zoom level, display or position the windows for 2 different documents. The View tab has 5 groups; Document Views, Show, Zoom, Window, and Macros.
A tab stop is a term used to describe the location the cursor stops after the tab key is pressed. Tab stops are used in word processors to enable users to align text by pressing the tab key. In Microsoft Word, the tab selector, also called the tab indicator, is a button to the left of the ruler that supplies the user with a variety of tab marker options.
Types of tab stops-
Below are explanations of each of the five different tab stops.
The ruler is a measurement tool found in MS word that allow the user to align graphics, text, tables, or other elements on a page. When enabled the horizontal ruler appears at the top of the document, and the vertical ruler is on the left-side of the document.
The status bar, which is a horizontal area at the bottom of the document window in Microsoft Word, provides information about the current state of what user are viewing in the window and any other contextual information. It shows the Page number (Shows the page number) and Number of words in the document itself.
The title bar is a bar located along the top of a window or a dialog box that displays the name of the window or software program being used.
Abbreviated as QAT is a toolbar menu that appears in Microsoft Word in the top left comer of the window. The Quick Access Toolbar gives user quick access to commonly used features such as the Save feature. Clicking on the Quick Access Toolbar down arrow gives user the ability to customize the Quick Access Toolbar and add and remove any of the commands shown in the toolbar.
MICROSOFT WORD SHORT CUTS
|
SHORTCUT |
DESCRIPTION |
|
Ctrl + 0 |
Adds or removes 6 pts of spacing before a paragraph. |
|
Ctrl + A |
Select all contents of the page. |
|
Ctrl + B |
Bold highlighted selection. |
|
Ctrl + C |
Copy selected text. |
|
Ctr + D |
Open the font preferences window. |
|
Ctrl + E |
Aligns the line or selected text to the center of the screen. |
|
Ctrl +F |
Open find box. |
|
Ctrl +1 |
Italic highlighted selection. |
|
Ctrl +J |
Aligns the selected text or line to justify the screen. |
|
Ctrl +K |
Insert link. |
|
Ctrl +L |
Aligns the line or selected text to the left of the screen. |
|
Ctrl + M |
Indent the paragraph. |
|
Ctrl +P |
Open the print window. |
|
Ctrl +R |
Aligns the line or selected text to the right of the screen. |
|
Ctrl +S |
Save the open document. Just like Shift + F12. |
|
Ctrl + T |
Create a hanging indent. |
|
Ctrl + U |
Underline the selected text. |
|
Ctrl + V |
Paste. |
|
Ctrl +X |
Cut selected text. |
|
Ctrl + Y |
Redo the last action performed. |
|
Ctrl + Z |
Undo last action. |
|
Ctrl + Shift + L |
Quickly create a bullet point. |
|
Ctrl + Shift + F |
Change the font. |
|
Ctrl + Shift + > |
Increase selected font +l pts up to 12pt and then increase font +2pts. |
|
Ctrl + ] |
Increase selected font +1pts. |
|
Ctrl + Shift + < |
Decrease selected font -1pts if 12pt or lower; if above 12, decreases font by +2pt. |
|
Ctrl + [ |
Decrease selected font -1pts. |
|
Ctrl + |
Moves one word to the left. |
|
Ctrl + |
Moves one word to the right. |
|
Ctrl + |
Moves to the beginning of the line or paragraph. |
|
Ctrl + |
Moves to the end of the paragraph. |
|
Ctrl + Del |
Deletes word to right of cursor. |
|
Ctrl + Backspace |
Deletes word to left of cursor. |
|
Ctrl + End |
Moves the cursor to the end of the document. |
|
Ctrl + Home |
Moves the cursor to the beginning of the document. |
|
Ctrl + Spacebar |
Reset highlighted text to the default font. |
|
Alt + Ctrl + F2 |
Open new document. |
|
Ctrl + F2 |
Display the print preview. |
|
Ctrl + Shift + F 12 |
Prints the document. |
|
F1 |
Open Help. |
|
F4 |
Repeat the last action performed |
|
F5 |
Open the Find, Replace, and Go To window in Microsoft Word. |
|
F7 |
Spellcheck and grammar check selected text or document. |
|
F12 |
Save As. |
|
Shift + F3 |
Change the text in Microsoft Word from uppercase to lowercase or a capital letter at the beginning of every word. |
|
Shift + F12 |
Save the open document. Just like Ctrl + S. |
|
Shift + Enter |
Create a soft break instead of a new paragraph. |
|
Shift + Insert |
Paste. |
|
Shift + Alt + D |
Insert the current date. |
|
Shift + Alt +T |
Insert the current time. |
In addition to the above shortcut keys, users can also use their mouse to perform some common actions. Below some are examples of mouse shortcuts.
|
MOUSE SHORTCUTS |
DESCRIPTION |
|
Click, hold, and drag |
Selects text from where user click and hold to the point user drag and let go. |
|
Double-click |
If double-clicking a word, selects the complete word. |
|
Double-click |
Double-clicking on the left, center, or right of a blank line makes the alignment of the text left, center, or right aligned. |
|
Double-click |
Double-clicking anywhere after text on a line will set a tab stop. |
|
Triple-click |
Selects the line or paragraph of the text that the mouse triple-clicked on. |
|
Ctrl + Mouse wheel |
Zooms in and out of document. |
BASICE OF MICROSOFT EXCEL
Microsoft excel is among the most widely used in various business fieds. A lot of fields these days require basic Excel skills. These basic Excel skills are - familiarity with Excel ribbons & UI, ability to enter and format data, calculate totals & summaries through different kinds of formulas, highlighting of data that meets certain conditions, creating simple reports & charts, understanding the importance of keyboard shortcuts & productivity tricks.
How to Start the MS Excel Program
Click Start\[\to \]All Programs\[\to \]Microsoft Office\[\to \]Microsoft Excel
File format for the sheets created is .xlsx or .xls
PARTS OF THE EXCEL WINDOW
Besides the usual window components (close box, title bar, scroll bars, etc.), an Excel window has several unique elements identified in the figure below.
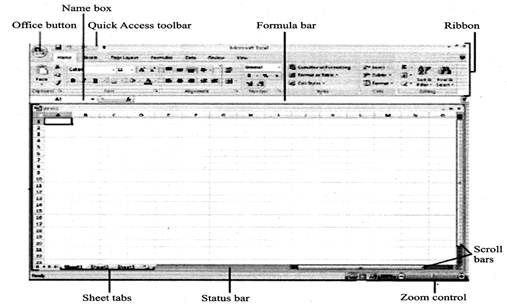
There are some important areas in the screen:
It is at the top left comer contains many commands for the document such as New, Open, Save, Save as, Print and Close.
A small toolbar next to the Office button contains shortcuts for some of the most common commands such as Save, Undo, and Redo buttons.
Tabs are part of the horizontal ribbon menu that contains links to various features of the program. Each tab - such as Home, Page Layout, and Formulas - contains a number of related features and options that are activated by clicking on the appropriate icon.
This is where any calculations or formulas user would like to write will appear. This is used to start building formulas.
This is where all user numbers, data, charts & drawings are present. Each Excel file can contain several sheets. But the spreadsheet grid shows few rows & columns of active spreadsheet. To see more rows or columns user can use, the scroll bars to the left or at bottom.
This tells us what is going on with Excel at any time. User can tell if Excel is busy calculating a formula, creating a pivot report or recording a macro by just looking at the status bar. The status bar also shows quick summaries of selected cells (count, sum, average, minimum or maximum values). User can change this by right clicking on it and choosing which summaries to show.
In Microsoft Excel, a sheet, sheet tab, or worksheet tab is the current worksheet that is being displayed. Every Excel file is capable of having multiple worksheets, and after opening an Excel file, user will see multiple sheet tabs as shown in the picture. By default, user have three sheet tabs "Sheet 1" the default worksheet, "Sheet2", "Sheet3", and an additional tab that allows user to add additional sheets to the Excel file.
Located in the bottom right comer of the Excel screen, the zoom slider is used to change the magnification of a worksheet by dragging the slider box back and forth or by clicking on the Zoom Out and Zoom In buttons located at either end of the slider.
Microsoft Excel, the Name Box is the box to the left of the formula bar that displays the cell that is currently selected in the spreadsheet. If a name is defined for a cell that is selected, the Name Box displays the name of the cell. User can use the Name Box to define a name for a selected cell as well. The picture shows an example of the Name box in Microsoft Excel.
SOME IMPORTANT TERMS IN EXCEL
ROW NUMBERS: Rows run horizontally in a worksheet and are identified by a number in the row header.
COLUMN LETTER: Columns run vertically on a worksheet and each one is identified by a letter in the column header.
Together a column letter and a row number create a cell reference. Each cell in the worksheet can be identified by this combination of letters and numbers such as A1, F456, or AA34.
Macros- An Excel macro is a set of instructions that can be triggered by a keyboard shortcut, toolbar button or an icon in a spreadsheet.
Macros- are used to eliminate the need to repeat the steps of common tasks over and over.
Tasks such as:
In Microsoft Office 2010 version, Office tab is replaced by File tab.
CHARTS
Charts are visual representations of worksheet data. Charts often makes it easier to understand the data in a worksheet because users can easily pick out patterns and trends illustrated in the chart that are otherwise difficult to see.
A chart is a made-up of many parts. Following are the parts of charts:
DIFFERENT TYPES OF CHARTS SERVE DIFFERENT PURPOSES
MICROSOFT EXCEL SHORTCUTS
Below is a listing of all the major shortcut keys usable in Microsoft Excel. See the computer shortcut page if user are looking for shortcut keys used in other programs.
|
SHORTCUT |
DESCRIPTION |
|
F2 |
Edit the selected cell. |
|
F3 |
After a name has been created, F3 will paste names. |
|
F4 |
Repeat last action. For example, if user changed the color of text in another cell, pressing F4 will change the text in cell to the same color. |
|
F5 |
Go to a specific cell. For example, C6. |
|
F7 |
Spell check selected text or document. |
|
F11 |
Create chart from selected data. |
|
Ctrl + Shift + ; |
Enter the current time. |
|
Ctrl + ; |
Enter the current date. |
|
Alt + Shift+F1 |
Insert New Worksheet. |
|
Alt + Enter |
While typing text in a cell, pressing Alt + Enter will move to the next line, allowing for multiple lines of text in one cell. |
|
Shift + F3 |
Open the Excel formula window. |
|
Shift + F5 |
Bring up search box. |
|
Ctrl + 1 |
Open the Format Cells window. |
|
Ctrl + A |
Select all contents of the worksheet. |
|
Ctrl + B |
Bold highlighted selection. |
|
Ctrl +1 |
Italic highlighted selection. |
|
Ctrl +K |
Insert link. |
|
Ctrl + S |
Save the open worksheet. |
|
Ctrl + U |
Underline highlighted selection. |
|
Ctrl + P |
Bring up the print dialog box to begin the printing process. |
|
Ctrl + Z |
Undo last action. |
|
Ctrl + F3 |
Open Excel Name Manager. |
|
Ctrl + F9 |
Minimize current window. |
|
Ctrl + F10 |
Maximize currently selected window. |
|
Ctrl + Page up |
Move between work sheets in the same document. |
|
Ctrl + Page down |
Move between work sheets in the same document. |
|
Ctrl + Tab |
Move between Two or more open Excel files. |
|
Alt + = |
Create a formula to sum all of the above cells. |
|
Ctrl + ' |
Insert the value of the above cell into the cell currently selected. |
|
Ctrl + Arrow key |
Move to next section of text. |
|
Ctrl + Space |
Select entire column. |
|
Shift + Space |
Select entire row. |
|
Ctrl + - |
Delete the selected column or row. |
|
Ctrl + Shift + = |
Insert a new column or row. |
|
Ctrl + Home |
Move to cell A1. |
FORMULA BAR
The formula bar is located beneath the toolbar at the top of the Excel worksheet. Use the formula bar to enter and edit worksheet data. The contents of the active cell always appear in the formula bar. When user click the mouse in the formula bar, an X and a check mark appear. User can click the check icon to confirm and completes editing, or the X to abandon editing.
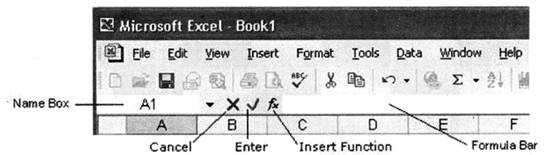
Name box
The Name box displays the reference of the selected cells.
Row and column headings
Letters and numbers identify the rows and columns on an Excel spreadsheet. The intersection of a row and a column is called a cell. Use row and column headings to specify a cell's reference. For example, the cell located where column B and row 7 intersect is called B7.
Active cell
The active cell has a dark border around it to indicate user position in the worksheet. All text and numbers that user type are inserted into the active cell. Click the mouse on a cell to make it active.
Fill handle
The lower right comer of the active cell has a small box called a Fill Handle. User mouse changes to a cross-hair when user are on the Fill Handle. The Fill Handle helps user copy data and create series of information. For example, if user type January in the active cell and then drag the Fill Handle over four cells. Excel automatically inserts February, March, April and May.
Worksheet tabs
An Excel workbook consists of multiple worksheets. Use the worksheet tabs at the bottom of
Alignment
By default, Excel left-aligns labels and right-aligns values in a worksheet. User can change cell alignment using the toolbar or the Format Cells command.
The toolbar has text alignment icons next to the bold and italic icons. User can left-align, right-align, or center text within a cell using these buttons. Select the cell(s) user want to align and click the appropriate alignment button on the toolbar.
The toolbar also has a button that will center a label over a range of cells, for example centering a title over a report. To center data over a range of cells, select the cell user want to center and the columns user want to center it over and click the Center over Cells button (shown at right).
Format Alignment command
User can also change the alignment of data within cells using the Alignment section of the Format Cells dialog. This dialog box also has options to change the orientation of text (i.e. sideways or vertical) and a box to wrap text within a cell.
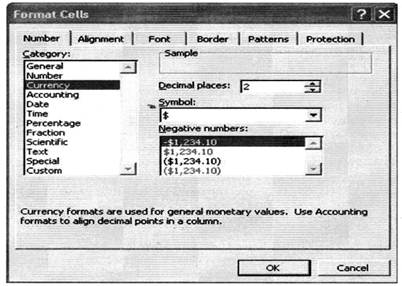
Changing Numeric Formatting
To change the format of a number, choose the Cells command from the Format menu. In the Format Cells dialog box. Excel displays different tabs for various formatting types. To change numeric formats, click the Number tab. Select the category user want and then the actual format. For example, to display numbers as currency with two decimal places, select the Currency category, enter 2 for the number of decimal places, and select the appropriate currency symbol. Or to display a number as a percentage, choose the Percentage category and select the number of decimals user want to display.
Placing borders around cells
The toolbar has a button for placing borders around cells. User can also use the Border section of the Format Cells dialog box, which provides more options. Select the cells user want a border on and choose the desired format from either the toolbar or the Format Cells dialog box. width in this way, a numeric width indicator appears in the upper left part of the formula bar.
FORMULAS AND FUNCTIONS
Formulas and functions that perform calculations are the true power of spreadsheets.
Formulas
To build a formula, first select the cell in which user want the results to appear. In Excel, all formulas start with the = sign. After the = sign, type the cells user want to add or subtract along with the mathematical operation user wish to perform. For example, to add the January sales in the worksheet below, the formula would be =B3+B4+B5. If user want to subtract February Widget Sales from January Widget sales, the formula would be=B3-C3.
|
|
A |
B |
C |
D |
E |
F |
G |
H |
|
1 |
|
|
|
|
|
|
|
|
|
2 |
|
January |
February |
March |
April |
May |
Totals |
%?S |
|
3 |
Widgets |
98 |
39 |
40 |
140 |
240 |
|
|
|
4 |
Figets |
122 |
18 |
50 |
150 |
250 |
|
|
|
5 |
Digets |
56 |
52 |
60 |
160 |
260 |
|
|
|
6 |
|
|
|
|
|
|
|
|
|
7 |
Totals |
|
|
|
|
|
|
|
![]()
Copying Formulas
The easiest way to copy a formula is with the Fill Handle in the lower right comer of the cell. Create user initial formula and then position the mouse on the Fill .Handle. When the mouse changes shape to a cross-hair, press and drag over the adjacent cells user want to copy the formula to.
SUM () function
The SUM () function is probably the most common function in Excel. It adds a range of numbers. To build a SUM () function, begin by typing the = sign; all functions begin with the = sign. Next type the word SUM followed by an open parenthesis. User must now tell Excel which cells to sum. Using the mouse, click and drag over the range of cells user wish to add. A dotted outline will appear around the cells and the cell range will be displayed in the formula bar. When user have the correct cells selected, release the mouse button, type a closing parenthesis and press the key.
If user do not want to use the mouse, type in the references of the cells user want to sum. For example, to add cells B3 through B5, type =SUM (B3:B5). Excel interprets B3.-B5 as the range of cells from B3 to B5.
AutoSum button
In Excel, the standard toolbar has a button that simplifies adding a column or row of numbers. The AutoSum button, which resembles the Greek letter Sigma (shown at right), automatically creates a SUM ( ) function. When user click the AutoSum button Excel creates a sum function for the column of numbers directly above or the row of numbers to the left. Excel pastes the SUM () function and the range to sum into the formula bar. If the range is not correct, simply select the proper range with user mouse on the worksheet. When user have the correct range entered, press the key to complete the function.
Using the Insert Function Button
The Insert Function Button is located by the Formula Bar.
Click the Insert function button in to activate the Insert Function dialog window.
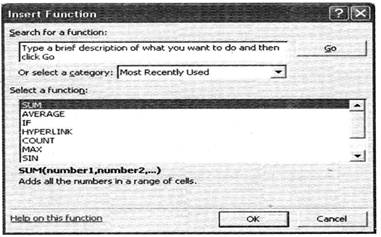
First, choose the Function Category user are interested in from the select a category drop down menu.
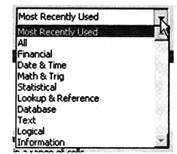
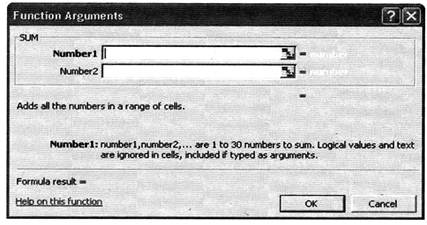
Then select the function user want in that category. When user have selected the proper function click OK. In the Function Arguements dialog box user specify the cells the function will operate on, which are called its arguments. Select the cells with the mouse and click OK. Notice the creation of the function in the formula bar.
BASICE OF MICROSOFT ACCESS
Microsoft Access is a versatile relational database program that enables user to efficiently store and retrieve data. This will explains how to navigate the Access interface, create simple tables and queries, and relate information from one table to another.
How to start MS Access Program
Click start\[\to \] All programs\[\to \]Microsoft office\[\to \]Microsoft Access.
PARTS COMPONENTS OF THE ACCESS WINDOW
Besides the usual window components (close box, title bar, scroll bars, etc.), an Access window has several unique elements identified in the figure below:
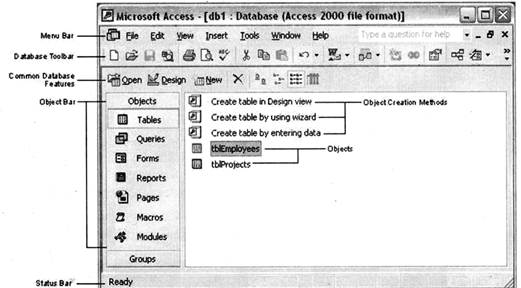
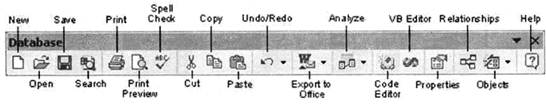
The Database toolbar, located beneath the menu bar, has buttons for commonly performed tasks like accessing the Relationships window, adding Objects, Exporting to Office, and other operations. Access let's user customize the toolbar or even display multiple toolbars at the same time. The Standard Access XP toolbar appears undocked in the figure below.
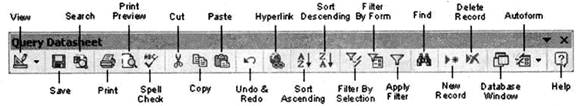
2. The Data sheet Toolbar
The Data sheet toolbar provides common tasks for editing an object in Data sheet view. The Database toolbar will automatically change into the Data sheet toolbar when this view is selected. The Data sheet tool bar exists between different objects, thus, this toolbar largely remains consistent.
3. The Design Toolbar
The Design toolbar provides common tasks for editing an object in Design view. The Database toolbar will automatically change into the Design toolbar when this view is selected. The Design tool bar exists between different objects, and thus, maintains much of the same functionali

COMMON DATABASE FEATURES
Access provides a quick and convenient method of accessing the most common tasks. This includes switching between views, opening and creating new databases, and a few minor formatting issues
Creating a Database
When user start Access there are no databases open, but the Task Pane is visible and provides quick access to common options such as opening an existing database or creating a new database. To create a database, select Blank Database under the New subgroup.

COMPONENTS OF MICROSOFT ACCESS
An Access database consists of seven different components. These are: tables, queries, forms, reports, pages, macros, and modules. Use the buttons in the database window shown below to create and modify these components. Each component listed is called an object.
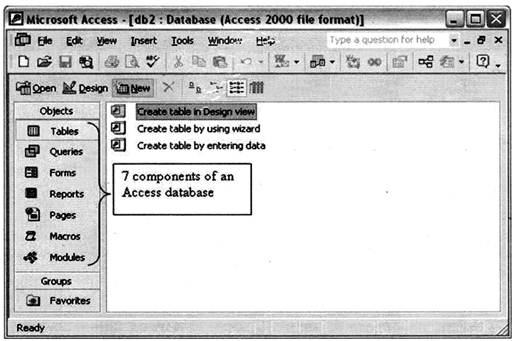
Listed below are the names and descriptions of the different objects user can use in Access. This will focus on the first two objects: tables and queries.
Tables: Tables are where the actual data is defined and entered. Tables consist of records (rows) and fields (columns).
Queries: Queries are basically questions about the data in a database. A query consists of specifications indicating which fields, records, and summaries want to see from a database. Queries allow to extract data based on the criteria user define.
|
Query Type |
Description |
|
Select query |
Retrieves data from one or more tables and displays the record set in a datasheet. This is the most common type of query. |
|
Parameter query |
Prompts the user to enter values that define the query, such as specified region for sales results or a specified price range for houses. |
|
Cross-tab query |
Arranges a recordset to make it more easily visible, using both row headings and column headings. |
|
Action query |
Creates a new table or changes an existing table. |
|
SQL query |
An advanced query that is created by using an SQL statement. |
Forms: Forms are designed to ease the data entry process. For example, To create a data entry form that looks exactly like a paper form.
Reports: When a user want to print records from user database, design a report. Access even has a wizard to help produce mailing labels.
Pages: A data access page is a special type of Web page designed for viewing and working with data from the Internet or an intranet. This data is stored in a Microsoft Access database or a Microsoft SQL Server database.
Macros: A macro is a set of one or more actions that each performs a particular operation, such as opening a form or printing a report. Macros can help user automate common tasks. For example, user can run a macro that prints a report when a user clicks a command button.
Modules: A module is a collection of Visual Basic for Applications declarations and procedures that are stored together as a unit.
Elements of MS-Access
In MS-Access, database holds five major elements for every database operation.
Field Name: It is a label provide for a field that specifies the type of information contained in a particular field.
Field Type/Data Type: It specifies the type of data stored in the field such as textual data and numerical data or combination of both. The default size of data type is 50 in MS-Access.
|
Data type |
Field Length or Field size |
|
Text |
0-255 characters |
|
Memo |
0.65535 characters |
|
Number |
1, 2, 4 or 8 bytes |
|
Date/Time |
8 bytes |
|
Currency |
8 bytes |
|
Auto Number 4 bytes |
4 bytes |
|
Yes/No |
1 bit (0 or 1) |
|
OLE object |
Upto 1 GB |
|
Hyperlink |
Each part contains 2048 characters |
SOME IMPORTANT TERMS-
Field Length: Field refers length or width to the maximum number of characters that a field can contain.
Primary Key: A field which is used to uniquely identify the records in a table. The primary key cannot contain null value.
Validation Rule: It is a condition that must be met before the data is accepted into the database.
MS -Access View
You can create a table by two most popular ways
Database View: It shows the data in the database and also allows you to enter and edit the data but not allow to change the database.
Design View: It allows you to create or change the table and set the keys.
Filtering Data: It enables to display only those records in a table that meet a specified filter criterion.
Relationship: It is an association between access table or quarries that use related field. It is a link between tables and enables us to accessed data from both table simultaneously.
Relationship can be divided in three categories; One-in-One, One-to-Many and Many-to-many.
Attributes: Attributes can be defined as the characteristics of an entity to identify in uniquely. Such as student’s attributes are his Roll-No, Section, Name etc.
AMS ACCESS: SHORTCUTS
The following is a list of general shortcuts or hotkeys in Access:
|
Key sequence |
Description |
|
F1 |
Display the Microsoft Access Help. This may be context-sensitive help depending on what you are positioned on. |
|
F11 |
Display the Database window. |
|
F12 |
Open the Save As dialog box. |
|
CTRL+N |
Open a new database. |
|
CTRL+0 |
Open an existing database. |
|
CTRL+P |
Print the current or selected object. |
|
CTRL+S |
Save the current database object. |
|
CTRL+W |
Close the active window. |
|
ALT+SPACEBAR |
Display the Control menu. |
|
ALT+F11 |
Toggle between the Visual Basic editor and the Access Database window. |
|
SHIFT+F10 |
Display the shortcut menu (ie: popup menu). |
Shortcut Keys For Entering Data In A Datasheet/Form
The following is a list of shortcuts or hot keys for entering data in a Datasheet/Form:
|
Key Sequence |
Description |
|
CTRL+PLUS SIGN (+) |
Add a new record. |
|
CTRL+MINUS SIGN (or older) |
Delete the current record. |
|
CTRL+SEMICOLON (;) |
Insert the current date. |
|
CTRL+COLON (:) |
Insert the current time. |
|
CTRL+ALT+SPACEBAR |
Insert the default value for the field. |
|
CTRL+ENTER |
Insert a new line. |
|
SHIFT+ENTER |
Save changes to the current record. |
|
SPACEBAR |
Toggle between the values in a check box or radio button. |
SHORTCUT KEYS FOR WORKING WITH TEXT/DATA
The following is a list of shortcuts or hot keys for working with text/data in Access:
General
|
Key Sequence |
Description |
|
F7 |
Check spelling. |
|
CTRL+C |
Copy the selection to the Clipboard. |
|
CTRL+V |
Paste the contents of the Clipboard to where the insertion point is. |
|
CTRL+X |
Cut the selection and copy it to the Clipboard. |
|
CTRL+Z |
Undo typing. |
|
CTRL+DELETE |
Delete all characters to the right of the insertion point. |
|
CTRL+SEMICOLON (;) |
Insert the current date. |
|
CTRL+COLON (:) |
Insert the current time. |
|
CTRL +ALT + SPACEBAR |
lnsert the default value for the field. |
|
ESC |
Undo changes in the current field. Press ESC a second time to undo changes to the current record. |
|
SHIFT + F2 |
Open the Zoom box to enter large amounts of data that cannot be properly displayed in a small control. |
Finding and Replacing Text
|
Key Sequence |
Description |
|
CTRL+F |
Open the Find tab on the Find and Replace dialog box. |
|
CTRL+H |
Open the Replace tab on the Find and Replace dialog box. |
|
SHIFT + F4 |
Find the next occurrence of the value entered in the Find and Replace dialog, box when the dialog box is closed. |
Selecting Text in A Field
|
Key Sequence |
Description |
|
SHIFT+RIGHT ARROW |
Extends selection one character to the right. |
|
SHIFT+LEFT ARROW |
Extends selection one character to the left. |
|
CTRL+SHIFT+RIGHT ARROW |
Extends selection one word to the right. |
|
CTRL+SHIFT+LEFT ARROW |
Extends selection one word to the left. |
Moving The Insertion Point in A Field
|
Key Sequence |
Description |
|
RIGHT AROW |
Move one character to the right. |
|
LEFT ARROW |
Move one character to the left. |
|
CTRL+RIGHT ARROW |
Move one word to the right. |
|
CTRL+LEFT ARROW |
Move one word to the left. |
|
END |
Move to the end of the field, in a single-line field. |
|
HOME |
Move to the beginning of the field, in a single-line field. |
|
CTRL+END |
Move to the end of the field, in a multi-line field. |
|
CTRL+HOME |
Move to the beginning of the field, in a multi-line field. |
BASICS OF MICROSOFT POWERPOINT
PowerPoint is a program to help create and present presentations. This handout introduces the basic features of Microsoft PowerPoint and covers the basics of creating simple presentations and editing and formatting the PowerPoint slides. PowerPoint 2007 is a presentation software application from Microsoft. With PowerPoint, user can easily create slide shows, presentations, and multimedia applications. Teachers, Trainers and other presenters can use slide shows to illustrate their presentations.
How to start MS-Powerpoint-
Click start\[\to \]All programs\[\to \]Microsoft Office\[\to \]Microsoft Power point
File format for the slides created is .pptx or ppt.
1. The Microsoft office Button
In the upper-left comer of the PowerPoint 2007 window is the Microsoft Office button. It>s similar to the old File Menu. When user click the button, a menu appears. User can use the menu to create a new file, open an existing file, save a file, print, and perform many other tasks.

2. The Quick Access Toolbar

Next to the Microsoft Office button in the upper left comer is the Quick Access toolbar outlined in red in the image above.
The Quick Access toolbar provides with access to commands that are frequently used. By default, Save, Undo, and Redo appear on the Quick Access toolbar. User use Save to save the file, Undo to rollback an action user have taken, and Redo to reapply an action user have rolled back. User can customize this toolbar by right clicking on it or click the small black down arrow to the right.

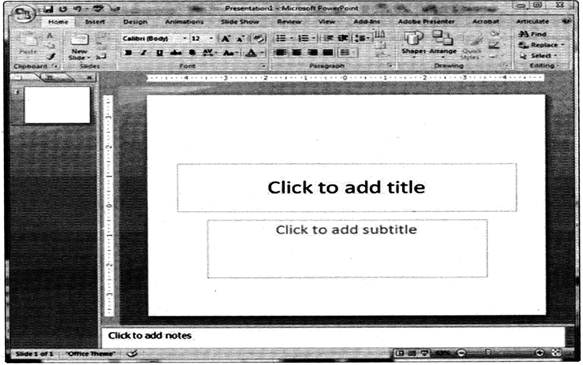
The Title bar is located at the top in the center of the PowerPoint window. The Title bar displays the name of the presentation on which user are currently working. By default, PowerPoint names presentations sequentially, starting with Presentation 1. When user save user file, user can change the name of user presentation.
4. The Ribbon

The Ribbon holds all of the commands and features of each of the tabs in the Ribbon. The Tabs are located across the top of the ribbon under the Title Bar. These contextual tabs will appear when user have something highlighted that calls for it. For example, if user have a picture highlighted on its slide, a Picture Tools tab will appear.
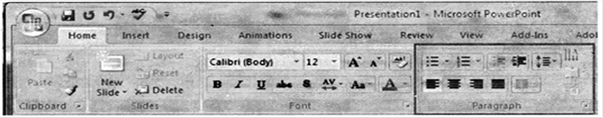
Similar tools are located in Command Groups across the ribbon.

Each Command Group includes Command Buttons to perform various actions on that group of tools.

Clipboard: Contains the cut, copy, paste commands. The Format Painter tool is located here as are the Paste Special, Paste as Hyperlink, and Duplicate commands.
Slides: All the commonly used commands for creating new slides Font: Includes the most commonly used commands for formatting font
Paragraph: Includes all of the paragraph formatting commands, vertical and horizontal alignments, text direction, bullets, numbering, indenting, spacing before and after, columns, etc. It also includes the dialog box for tabs.
Drawing: Allows to add shapes and draw on slides. This is Format Shape Dialog Box. The Status bar generally appears at the bottom of the window.
The Status bar displays the number of the slide that is currently displayed, the total number of slides, and the name of the design template in use or the name of the background.
The Outline tab displays the text contained in presentation in an outline format. The Slides tab displays a thumbnail view of all slides. User can click the thumbnail to view the slide in the Slide pane.
The View buttons appear near the bottom of the screen. User can use the View buttons to change between Normal view, Slider Sorter view, and the Slide Show view.
![]() Normal View
Normal View
Normal view splits the screen into three major sections: the Outline and Slides tabs, the Slide pane, and the Notes area.
The Outline and Slides tabs are on the left side of window. They enable to shift between two different ways of viewing your slides. The Slides tab shows thumbnails of your slides. The Outline tab shows the text on r slides. The Slide pane is located in the center of your window. The Slide pane shows a large view of the slide on which user currently working. The Notes area appears below the Slide pane. User can type notes on the Notes area.
![]() Slide Sorter View
Slide Sorter View
Slide Sorter view shows thumbnails of all slides. In Slide Sorter view, user can easily add, delete, or change their order of your slides.
![]() Slide Show View
Slide Show View
Use the Slide Show view when want to view slides, as they will look in final presentation. When in Slide Show view:
Esc - Returns to the view using previously.
Left-clicking - Moves you to the next slide or animation effect. When reach the last slide, automatically return to previous view.
Right-clicking - Opens a pop-up menu. User can use this menu to navigate the slides, add speaker notes, select a pointer, and mark presentation.
![]()
Zoom In & Zoom Out
Zoom controls allows you to zoom in and zoom out on the window. Zooming in makes the window larger so focus in on an object. Zooming out makes the window smaller so user can see the entire window.
You can click and drag the vertical and horizontal splitter bars to change the size of your panes.
![]() User use the Minimize button to remove a window from view. While a window is minimized, its title appears on the task bar.
User use the Minimize button to remove a window from view. While a window is minimized, its title appears on the task bar.
![]() Click to the Maximize button to cause a window to fill the screen. After maximize a window, clicking the Restore button returns the window to its former smaller size.
Click to the Maximize button to cause a window to fill the screen. After maximize a window, clicking the Restore button returns the window to its former smaller size.
![]() Click to the Close button to exit the window and close the program.
Click to the Close button to exit the window and close the program.
MS- Power Point Shortcuts
|
Shortcut Key |
Description |
|
F5 |
View the Slide Show |
|
Shift + Ctrl + Home
|
Selects all text form the cursor to the sart of the active text box |
|
Shift + Ctrl + End |
Selects all text form the cursor to the end of the active text box |
|
Spacebar or click the mouse |
Moves to next slide or next animation |
|
S |
Stop the show press S again to restrat the show |
|
Esc |
End the side show |
|
Ctrl + A |
Select all items on the page or the active text box |
|
Ctrl +B |
Applies bold to the select text |
|
Ctrl + D |
Duplicates the selected object |
|
Ctrl + F |
Opens the find dialog box |
|
Ctrl + G |
Opens the grids and guies dialog box |
|
Ctrl + H |
Opens the replace dialog box |
|
Ctrl +1 |
Applies Italics to the selected text |
|
Ctrl + M |
Inserts a new slide |
|
Ctrl + N |
Opens a new blank presentations |
|
Ctrl + 0 |
Opens the open dialog box |
|
Ctrl + T |
Opens the font dialog box |
|
Ctrl + U |
Applies underlining to the selected text Paste |
|
Ctrl + V |
Paste |
|
Ctrl + W |
Closes the presentation |
|
Ctrl + Y |
Repeats the last comand entered |
|
Home |
Moves cursor to beginning of current line of text |
|
End |
Moves cursor to end of current line of text |
|
Ctrl + Home |
Moves cursor in beginning of presentations |
|
Ctrl + End |
Moves cursor to end of presentation |
|
Shift + Click each side |
Selects more than one slide in a presentation |
|
Shift+F1 |
Help. |


You need to login to perform this action.
You will be redirected in
3 sec

