-
question_answer1)
Direction: The following Bar-diagram shows total number of males and females in five different organisations. Study it carefully to answer the question. [SSC CGL Tier II, 2017] 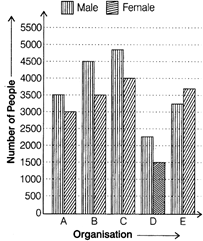 |
What is the difference between the total number of females and the total number of males from all the organisations together?
A)
2005 done
clear
B)
2050 done
clear
C)
2500 done
clear
D)
2055 done
clear
View Solution play_arrow
-
question_answer2)
Direction: The following Bar-diagram shows total number of males and females in five different organisations. Study it carefully to answer the question. [SSC CGL Tier II, 2017]  |
Males from organisations A and B together form what per cent of total number of males from organisations C, D and E together?
A)
78.04% done
clear
B)
87.44% done
clear
C)
47.08% done
clear
D)
74.08% done
clear
View Solution play_arrow
-
question_answer3)
Direction: The following Bar-diagram shows total number of males and females in five different organisations. Study it carefully to answer the question. [SSC CGL Tier II, 2017]  |
What is the ratio of average number of females from the organisations A, B and C to the average number of males from the organisations C, D and E?
A)
42 : 41 done
clear
B)
41 : 42 done
clear
C)
40 : 41 done
clear
D)
41 : 40 done
clear
View Solution play_arrow
-
question_answer4)
Directions: Study the following graph and answer the questions. [SSC CGL Tier II, 2015] The following graph shows production (in thousands) of two type (P and Q) of vehicles by a factory over the years 2009 to 2014.  |
The ratio of total production of Type P vehicles to total production of Type Q vehicles over the years is
A)
48 : 41 done
clear
B)
5 : 8 done
clear
C)
41 : 48 done
clear
D)
8 : 5 done
clear
View Solution play_arrow
-
question_answer5)
Directions: Study the following graph and answer the questions. [SSC CGL Tier II, 2015] The following graph shows production (in thousands) of two type (P and Q) of vehicles by a factory over the years 2009 to 2014. 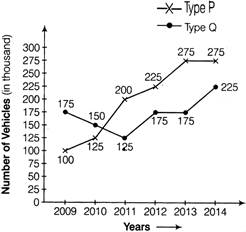 |
Approximate percentage decrease in production of Type Q vehicles from 2010 to 2011 is
A)
14.3 done
clear
B)
10.1 done
clear
C)
16.7 done
clear
D)
12.5 done
clear
View Solution play_arrow
-
question_answer6)
| Directions: Study the following graph and answer the questions. [SSC CGL Tier II, 2015] The following graph shows production (in thousands) of two type (P and Q) of vehicles by a factory over the years 2009 to 2014. |
The total production of Type P vehicles in the years 2009 and 2011 is what per cent of total production of Type Q vehicles in 2010 and 2014?
A)
75 done
clear
B)
80 done
clear
C)
81.25 done
clear
D)
69.25 done
clear
View Solution play_arrow
-
question_answer7)
| Directions: Study the following graph and answer the questions. [SSC CGL Tier II, 2015] The following graph shows production (in thousands) of two type (P and Q) of vehicles by a factory over the years 2009 to 2014. |
In how many of the given years, was the production of Type P vehicles of the company more than the average production of this vehicles in the given years?
A)
3 done
clear
B)
2 done
clear
C)
4 done
clear
D)
5 done
clear
View Solution play_arrow
-
question_answer8)
| Directions: Study the following graph and answer the questions. [SSC CGL Tier II, 2015] The following graph shows production (in thousands) of two type (P and Q) of vehicles by a factory over the years 2009 to 2014. |
The production of Type Q vehicles in 2010 was approximately what per cent of Type P vehicles in 2014?
A)
45.5 done
clear
B)
60 done
clear
C)
75 done
clear
D)
54,5 done
clear
View Solution play_arrow
-
question_answer9)
Directions: A watch company produces four different products. The sale of these products in lakhs during 2005 and 2010 are shown in the following bar diagram. Study the graph and answer the questions. [SSC CGL Tier II, 2014] 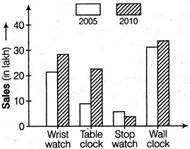 |
The sales in percentage of wrist watch in 2010 more than the sales of table clock in 2010 was nearly by
A)
26.7% done
clear
B)
27.7% done
clear
C)
28.7% done
clear
D)
21.7% done
clear
View Solution play_arrow
-
question_answer10)
Directions: A watch company produces four different products. The sale of these products in lakhs during 2005 and 2010 are shown in the following bar diagram. Study the graph and answer the questions. [SSC CGL Tier II, 2014]  |
The ratio of sales of stop watch in 2010 to the sale of table clock in 2005 is
A)
6 : 19 done
clear
B)
7 : 6 done
clear
C)
19 : 6 done
clear
D)
7 : 19 done
clear
View Solution play_arrow
-
question_answer11)
Directions: A watch company produces four different products. The sale of these products in lakhs during 2005 and 2010 are shown in the following bar diagram. Study the graph and answer the questions. [SSC CGL Tier II, 2014] 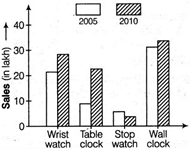 |
The sales of table clock in 2005 was less than the sales of wall clock in 2005 is nearly by
A)
70.05% done
clear
B)
69.05% done
clear
C)
68.05% done
clear
D)
62.05% done
clear
View Solution play_arrow
-
question_answer12)
| Directions: A watch company produces four different products. The sale of these products in lakhs during 2005 and 2010 are shown in the following bar diagram. Study the graph and answer the questions. [SSC CGL Tier II, 2014] |
During the period 2005-2010 the minimum rate of increase in sales is in the product of
A)
wrist watch done
clear
B)
table clock done
clear
C)
stop watch done
clear
D)
wall clock done
clear
View Solution play_arrow
-
question_answer13)
| Directions: A watch company produces four different products. The sale of these products in lakhs during 2005 and 2010 are shown in the following bar diagram. Study the graph and answer the questions. [SSC CGL Tier II, 2014] |
The sales have increased by nearly 135% from 2005 to 2010 in the product of
A)
table clock done
clear
B)
wrist watch done
clear
C)
stop watch done
clear
D)
wall clock done
clear
View Solution play_arrow
-
question_answer14)
Directions: Study the histogram weight distribution of different men and answer the question. 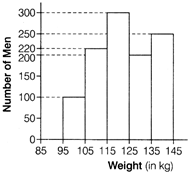 |
Average number of men per interval who participated in this survey is
A)
200 done
clear
B)
180 done
clear
C)
214 done
clear
D)
194 done
clear
View Solution play_arrow
-
question_answer15)
Given is a line graph showing the number of accidents in a city during the first 6 months of 1999.
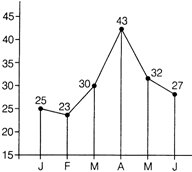
The decrease percentage of accidents from May to June is
A)
\[15\frac{3}{8}\] done
clear
B)
\[15\frac{1}{8}\] done
clear
C)
\[15\frac{5}{8}\] done
clear
D)
\[15\frac{7}{8}\] done
clear
View Solution play_arrow
-
question_answer16)
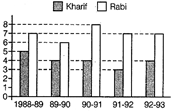
| The average Kharif production of the given years is |
| Production of Pulses in Rabi and Kharif Season (in million tonne) |
 |
A)
4 million tonne done
clear
B)
5 million tonne done
clear
C)
4.5 million tonne done
clear
D)
5.5 million tonne done
clear
View Solution play_arrow
-
question_answer17)
Directions: The annual agricultural production (in tonne) of an Indian state is given in the pie chart. The total production is 9000 tonne. Read the pie chart and answer the question. 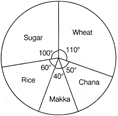 |
What is the annual production of Wheat?
A)
2750 tonne done
clear
B)
3000 tonne done
clear
C)
3540 tonne done
clear
D)
3500 tonne done
clear
View Solution play_arrow
-
question_answer18)
Directions: The following pie chart shows the details of 1500 employees working in a company in various scales and also the break-up of 800 male employees across the scales. Study the graphs and answer the questions. Break-up of 1500 Employees Across the Scales 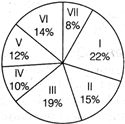 Break-up of 800 Male Employees Across the Scales Break-up of 800 Male Employees Across the Scales  |
How many females are working in scale V?
A)
180 done
clear
B)
144 done
clear
C)
96 done
clear
D)
84 done
clear
View Solution play_arrow
-
question_answer19)
| Directions: The following pie chart shows the details of 1500 employees working in a company in various scales and also the break-up of 800 male employees across the scales. Study the graphs and answer the questions. Break-up of 1500 Employees Across the Scales Break-up of 800 Male Employees Across the Scales |
The male-female ratio working in scale VII is
A)
1 : 2 done
clear
B)
2 : 1 done
clear
C)
2 : 3 done
clear
D)
3 : 2 done
clear
View Solution play_arrow
-
question_answer20)
Directions: The following pie chart shows the details of 1500 employees working in a company in various scales and also the break-up of 800 male employees across the scales. Study the graphs and answer the questions. Break-up of 1500 Employees Across the Scales Break-up of 800 Male Employees Across the Scales 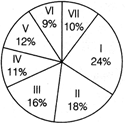 |
The scales in which the number of working females is the same are
A)
I and VI done
clear
B)
I and III done
clear
C)
III and VI done
clear
D)
Only III done
clear
View Solution play_arrow
-
question_answer21)
| Directions: The following pie chart shows the details of 1500 employees working in a company in various scales and also the break-up of 800 male employees across the scales. Study the graphs and answer the questions. Break-up of 1500 Employees Across the Scales Break-up of 800 Male Employees Across the Scales |
The number of scales in which the female workforce is less than the average female workforce working in any scale is
A)
5 done
clear
B)
2 done
clear
C)
3 done
clear
D)
None of these done
clear
View Solution play_arrow
-
question_answer22)
Directions: The following pie chart shows the details of 1500 employees working in a company in various scales and also the break-up of 800 male employees across the scales. Study the graphs and answer the questions. Break-up of 1500 Employees Across the Scales  Break-up of 800 Male Employees Across the Scales Break-up of 800 Male Employees Across the Scales |
Had the total number of employees working in the company been 1600 (800 male, 800 female) and pie charts of break-up across the scales the same, the percentage increase or decrease of Female workforce in scale VII is
A)
10% decrease done
clear
B)
15% increase done
clear
C)
20% decrease done
clear
D)
20% increase done
clear
View Solution play_arrow
-
question_answer23)
Directions: The following table shows the number of students of 7 colleges participating in extracurricular activities. Read the table and answer the questions. | Extracurricular activities | College | | A | B | C | D | E | F | G | | I II III IV | 200 | 300 | 500 | 100 | 400 | 300 | 200 | | 100 | 200 | 200 | 100 | 100 | 100 | 100 | | 65 | 130 | 420 | 75 | 540 | 220 | 153 | | 317 | 155 | 438 | 105 | 385 | 280 | 120 | |
The difference of the range of number of students in activity IV and the average of number of students in activity III per college is
A)
111 done
clear
B)
163 done
clear
C)
104 done
clear
D)
217 done
clear
View Solution play_arrow
-
question_answer24)
Directions: The following table shows the number of students of 7 colleges participating in extracurricular activities. Read the table and answer the questions. | Extracurricular activities | College | | A | B | C | D | E | F | G | | I II III IV | 200 | 300 | 500 | 100 | 400 | 300 | 200 | | 100 | 200 | 200 | 100 | 100 | 100 | 100 | | 65 | 130 | 420 | 75 | 540 | 220 | 153 | | 317 | 155 | 438 | 105 | 385 | 280 | 120 | |
Percentage of the number of students in activity II to that of IV is
A)
37 done
clear
B)
42 done
clear
C)
48 done
clear
D)
50 done
clear
View Solution play_arrow
-
question_answer25)
Directions: The following table shows the number of students of 7 colleges participating in extracurricular activities. Read the table and answer the questions. | Extracurricular activities | College | | A | B | C | D | E | F | G | | I II III IV | 200 | 300 | 500 | 100 | 400 | 300 | 200 | | 100 | 200 | 200 | 100 | 100 | 100 | 100 | | 65 | 130 | 420 | 75 | 540 | 220 | 153 | | 317 | 155 | 438 | 105 | 385 | 280 | 120 | |
The college in which minimum number of students participate in extra curricular activities is
A)
540 done
clear
B)
229 done
clear
C)
153 done
clear
D)
75 done
clear
View Solution play_arrow
-
question_answer26)
Directions: The following table shows the number of students of 7 colleges participating in extracurricular activities. Read the table and answer the questions. | Extracurricular activities | College | | A | B | C | D | E | F | G | | I II III IV | 200 | 300 | 500 | 100 | 400 | 300 | 200 | | 100 | 200 | 200 | 100 | 100 | 100 | 100 | | 65 | 130 | 420 | 75 | 540 | 220 | 153 | | 317 | 155 | 438 | 105 | 385 | 280 | 120 | |
The college in which minimum number of students participate in extra curricular activities is
A)
D done
clear
B)
G done
clear
C)
F done
clear
D)
A done
clear
View Solution play_arrow
-
question_answer27)
Directions: The following table shows the number of students of 7 colleges participating in extracurricular activities. Read the table and answer the questions. | Extracurricular activities | College | | A | B | C | D | E | F | G | | I II III IV | 200 | 300 | 500 | 100 | 400 | 300 | 200 | | 100 | 200 | 200 | 100 | 100 | 100 | 100 | | 65 | 130 | 420 | 75 | 540 | 220 | 153 | | 317 | 155 | 438 | 105 | 385 | 280 | 120 | |
The ratio of total number of students in II and I is
A)
1 : 2 done
clear
B)
9 : 20 done
clear
C)
19 : 7 done
clear
D)
21 : 10 done
clear
View Solution play_arrow
-
question_answer28)
Directions: The bar graph provided below represents the production of Rice and Wheat in different states of a country in the certain year. Answer questions based on the bar graph. 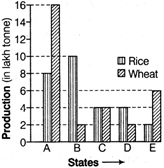 |
The total production of Rice and Wheat in all the mentioned states in minimum in the state
A)
B done
clear
B)
C done
clear
C)
D done
clear
D)
E done
clear
View Solution play_arrow
-
question_answer29)
Directions: The bar graph provided below represents the production of Rice and Wheat in different states of a country in the certain year. Answer questions based on the bar graph. 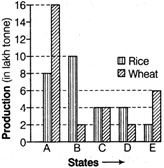 |
The ratio of total production of Rice in the mentioned states to that of Wheat in those states, is
A)
15 : 16 done
clear
B)
12 : 13 done
clear
C)
13 : 14 done
clear
D)
14 : 15 done
clear
View Solution play_arrow
-
question_answer30)
| Directions: The bar graph provided below represents the production of Rice and Wheat in different states of a country in the certain year. Answer questions based on the bar graph. |
The difference between the production in Rice and Wheat is maximum in
A)
Only A done
clear
B)
All of A, B and E done
clear
C)
B and E done
clear
D)
A and B done
clear
View Solution play_arrow
-
question_answer31)
| Directions: The bar graph provided below represents the production of Rice and Wheat in different states of a country in the certain year. Answer questions based on the bar graph. |
The state which is the largest producer of Rice is
A)
A done
clear
B)
B done
clear
C)
C done
clear
D)
D done
clear
View Solution play_arrow
-
question_answer32)
| Directions: The bar graph provided below represents the production of Rice and Wheat in different states of a country in the certain year. Answer questions based on the bar graph. |
The average of production of Rice in the mentioned states (in lakh tonne) is
A)
5.5 done
clear
B)
5.6 done
clear
C)
5.7 done
clear
D)
5.8 done
clear
View Solution play_arrow
-
question_answer33)
Directions: The following line diagram represents the yearly sales figure of a company in the years 2001-2010. Examine the diagram and answer the questions. 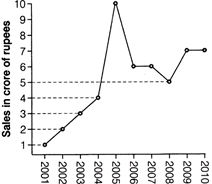 |
By what per cent did the sales in 2008 decrease in comparison to the sales in 2006?
A)
20 done
clear
B)
18 done
clear
C)
\[16\frac{2}{3}\] done
clear
D)
\[15\frac{2}{3}\] done
clear
View Solution play_arrow
-
question_answer34)
| Directions: The following line diagram represents the yearly sales figure of a company in the years 2001-2010. Examine the diagram and answer the questions. |
The ratio of sales in 2002 to that in 2007 is
A)
2 : 3 done
clear
B)
1 : 3 done
clear
C)
1 : 1 done
clear
D)
3 : 2 done
clear
View Solution play_arrow
-
question_answer35)
| Directions: The following line diagram represents the yearly sales figure of a company in the years 2001-2010. Examine the diagram and answer the questions. |
Average sale (in Rs. crore) of the company during the period 2003-2007 is
A)
5.2 done
clear
B)
5 done
clear
C)
6 done
clear
D)
5.5 done
clear
View Solution play_arrow
-
question_answer36)
Directions: The following line diagram represents the yearly sales figure of a company in the years 2001-2010. Examine the diagram and answer the questions.  |
The percentage increase in sales in the year 2005 with respect to the previous year is
A)
80 done
clear
B)
100 done
clear
C)
120 done
clear
D)
150 done
clear
View Solution play_arrow
-
question_answer37)
| Directions: The following line diagram represents the yearly sales figure of a company in the years 2001-2010. Examine the diagram and answer the questions. |
Total sales (in Rs. crore) from 2005 to 2008 is
A)
17 done
clear
B)
27 done
clear
C)
22 done
clear
D)
31 done
clear
View Solution play_arrow
-
question_answer38)
Directions: The pie-chart provided below gives the distribution of land (in a village) under various food crops. Study the pie-chart carefully and answer the questions.  |
If the total area under Bajra was three hundred acres, then the total area (in hundred acres) under Rice and Barley together is
A)
18 done
clear
B)
12 done
clear
C)
15 done
clear
D)
20 done
clear
View Solution play_arrow
-
question_answer39)
Directions: The pie-chart provided below gives the distribution of land (in a village) under various food crops. Study the pie-chart carefully and answer the questions. 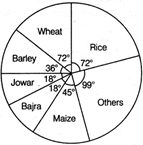 |
The combination of three crops which contribute to more than 50% of the total area under the food crops is
A)
Wheat, Rice and Maize done
clear
B)
Wheat, Rice and Jowar done
clear
C)
Wheat, Rice and Bajra done
clear
D)
Rice, Barley and Maize done
clear
View Solution play_arrow
-
question_answer40)
| Directions: The pie-chart provided below gives the distribution of land (in a village) under various food crops. Study the pie-chart carefully and answer the questions. |
The ratio of the land used for Rice and Barley is
A)
3 : 1 done
clear
B)
1 : 2 done
clear
C)
2 : 1 done
clear
D)
3 : 2 done
clear
View Solution play_arrow
-
question_answer41)
| Directions: The pie-chart provided below gives the distribution of land (in a village) under various food crops. Study the pie-chart carefully and answer the questions. |
If 10% of the land reserved for Rice be distributed to Wheat and Barley in the ratio 2 : 1, then the angle corresponding to Wheat in the new pie-chart will be
A)
\[38.4{}^\circ \] done
clear
B)
\[76.8{}^\circ \] done
clear
C)
\[75.6{}^\circ \] done
clear
D)
\[45.5{}^\circ \] done
clear
View Solution play_arrow
-
question_answer42)
| Directions: The pie-chart provided below gives the distribution of land (in a village) under various food crops. Study the pie-chart carefully and answer the questions. |
If the production of Rice is 5 times that of Jowar and the production of Jowar is 2 times that of Bazra, then the ratio between the yield per acre of Rice and Bazra is
A)
50 : 1 done
clear
B)
30 : 1 done
clear
C)
40 : 1 done
clear
D)
60 : 1 done
clear
View Solution play_arrow
-
question_answer43)
Directions: Study the graph below and answer the following questions. Percentage Distribution of Total Expenditure of a Company 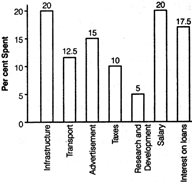 |
The total amount of expenditure of the company is how many times the total expenditure on Research and Development and Salary?
A)
2 done
clear
B)
4 done
clear
C)
15 done
clear
D)
20 done
clear
View Solution play_arrow
-
question_answer44)
| Directions: Study the graph below and answer the following questions. Percentage Distribution of Total Expenditure of a Company |
What is the ratio of total expenditure on infrastructure and transport to the total expenditure on taxes and interest on loans?
A)
5 : 4 done
clear
B)
8 : 7 done
clear
C)
9 : 7 done
clear
D)
13 : 11 done
clear
View Solution play_arrow
-
question_answer45)
| Directions: Study the graph below and answer the following questions. Percentage Distribution of Total Expenditure of a Company |
If the interest on loans amounted to Rs. 2.45 crore, then the total amount of expenditure, in crore of rupees, on advertisement, Taxes and Research and Development is
A)
7 done
clear
B)
5.4 done
clear
C)
4.2 done
clear
D)
3 done
clear
View Solution play_arrow
-
question_answer46)
| Directions: Study the graph below and answer the following questions. Percentage Distribution of Total Expenditure of a Company |
The expenditure on interest on loans is what per cent more than the expenditure on transport?
A)
5 done
clear
B)
10 done
clear
C)
20 done
clear
D)
40 done
clear
View Solution play_arrow
-
question_answer47)
Directions: Study the graph and answer the questions Demand and Production of Colour TV Sets of Five Companies A, B, C, D and E for October 2006  |
What per cent of the demand of company C is that of the company B?
A)
14 done
clear
B)
20 done
clear
C)
24 done
clear
D)
26 done
clear
View Solution play_arrow
-
question_answer48)
Directions: Study the graph and answer the questions Demand and Production of Colour TV Sets of Five Companies A, B, C, D and E for October 2006 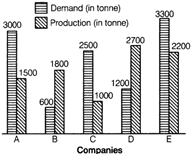 |
What is the difference between average demand and average production of the five companies taken together?
A)
1400 done
clear
B)
400 done
clear
C)
280 done
clear
D)
138 done
clear
View Solution play_arrow
-
question_answer49)
| Directions: Study the graph and answer the questions Demand and Production of Colour TV Sets of Five Companies A, B, C, D and E for October 2006 |
The average production of the companies A, B, C and that of the companies D, E are in the ratio
A)
85 : 147 done
clear
B)
86 : 147 done
clear
C)
86 : 149 done
clear
D)
87 : 149 done
clear
View Solution play_arrow


