Histogram
It is a graphical representation of a frequency distribution in the form of rectangles with class intervals as the base and height proportional to the corresponding frequencies so that there is no gap between the two successive rectangles. This method is used for the graphical representation of continuous class intervals. It is a two dimensional figure in which both the axes are used to show the data on the graph.
To draw a histogram, follow the steps given below:
Mark class intervals on X - axis and frequencies on Y - axis.
The scales for both the axes need not be the same.
Class intervals must be exclusive. If the intervals are in inclusive form, convert them to the exclusive form.
Draw rectangles with class intervals as bases and the corresponding frequencies as heights.
The class limits are marked on the horizontal axis and the frequency is marked on the vertical axis. Thus a rectangle is constructed on each class interval. If the intervals are equal, then the height of each rectangle is proportional to the corresponding frequency. If the intervals are unequal, then the area of each rectangle is proportional to the corresponding frequency.
Comparison of Histograms and Bar Graphs
Histogram
Frequency
It consists of rectangles touching each other.
It consists of rectangles, normally separated from each other with equal space.
The frequency is represented by the area of each rectangle.
The frequency is represented by height. The width has no significance.
It is two dimensional (width and height are considered).
It is one dimensional (only height is considered).
Pie Chart
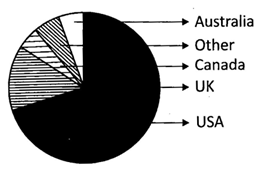
A pie chart is the pictorial representation of the given data with the help of non intersecting sectors of different areas and different central angles. The magnitude of the central angles depend on the magnitude of the data. In a pie chart, the arc length of each sector (and consequently its central angles and area), is proportional to the quantity it represents. When angles are measured with 1 turn as unit then a number of percent is identified together with the same number of turns. The sectors create a full disk. It is named for its resemblance to a pie which has been sliced. The earliest known pie chart is generally credited to William Play fair's Statistical Breviary in 1801.
Pie chart of populations of English native speakers
The data in the table represents the percentage of hours of the day spent by the individuals on various activities of the day. Give the pictorial representation of the data given below:
Developing Charts
Excel enables the Chart Wizard that helps you create and view block diagrams. Using chart you can view any analytical data in visual form that provides you easy picture.
To create and modify a chart:
Select Insert -> Chart menu option to display the Chart Wizard, as shown in the following figure:
Select a chart type.
Select a chart such as Bar chart and click the Next to enter a Data Range, as shown in the following figure:
Click Data Range box, select the area you need for the chart and click Next.
Type the chart name in the Chart title text box and values for X in the Category (X) axis text box and Y in the Value (Y) axis text box.
Click Finish to display the chart that you selected with my chart name.
The chart is created.
Which one of the following statements is true?
Statement A: The formula begins with a # sign.
Statement B: The formula begins with a = sign.
(A) Statement A is correct
(B) Statement B is correct
(C) Both statement A and B are correct
(D) Neither statement A nor statement B is correct
(E) None of these
Answer: (B)
Explanation
Correct Option:
(B) Only statement B is true.
Incorrect Options:
Rest of the options is incorrect.
Using formula you can perform arithmetic and logical operation. Which one of the following functions is used to count the non blank cells?
(A) COUNT
(B) DCOUNT
(C) DCOUNTA
(D) All of these
(E) None of these
Answer: (C)
Explanation
Correct Option:
(C) DCOUNTA is used to count the non blank cells in a column of a list or database that matches the specified conditions.
Incorrect Options:
Rest of the options is incorrect.
.............. is used to add the numbers in a column of a list or database that matches the specified conditions.
(A) DVAR
(B) DSUM
(C) SUM
(D) All of these
(E) None of these
Answer: (C)
Correct Option:
(C) DSUM s used to add the numbers in a column of a list or database that matches the specified conditions
Incorrect Options:
Rest of the options is incorrect.
Maximum numbers of columns you can enter in an Excel worksheet are 256.
The maximum numbers of rows you can enter in worksheet are 65,536 rows.
Object-Oriented Spreadsheets: Allows viewing, analyzing and mapping data in different ways.
Logical Spreadsheet: Enables logic functions rather than arithmetic functions that are used in deductive reasoning.
Using Formulas and Calculations
This feature enables you to perform complex calculations easily. Using formula you can performs arithmetic and logical operation. Generally, the formulas begin with an equal (=) sign.
To add the contents of a cell:
Select the cells, which you want to add.
Click Auto Sum to open the dropdown list and select sum to add the values of a cell, the sum will be displayed on the next cell.
To count the selected cell:
Select the cells, which you want to count.
Click AutoSum to open the dropdown list and select count to count the cell, the count will be displayed on the next cell.
MS Excel enables the following common functions:
DAVE RAGE
Is used to find the averages of the values in a database that matches the conditions specified by you. The syntax is:
DAVERAGE (database, field, criteria)
DCOUNT
Is used to count the cells containing numbers in a column of a list or database that matches specified conditions. The syntax is:
DCOUNT (database, field, criteria)
DCOUNTA
Is used to count the non blank cells in a column of a list or database that matches the specified conditions. The syntax is:
DCOUNTA (database, field, criteria)
DGET
Is used to retrieve a single value from a column of a list or database that matches conditions specified by you. The syntax is;
DGET (database, field, criteria)
DMAX
Is used to retrieve the largest number in a column of a list or database that matches conditions specified by you. The syntax is:
DMAX (database, field, criteria)
DMIN
Is used to retrieve the smallest number in a column of a list or database that matches conditions specified by you. The syntax is:
DMIN (database, field, criteria)
DPRODUCT
Is used to multiply the values in a particular field of records that matches the criteria in a database. The syntax is:
DPRODUCT (database, field, criteria)
DSUM
Is used to add the numbers in a column of a list or database that matches the specified conditions. The syntax is:
DSUM (database, field, criteria)
DVAR
Is used to estimate the population variance based on a sample with the use of numbers in a column of a list or database that matches the specified conditions. The syntax is:
DVAR (database, field, criteria).
Printing Worksheet
Printing provides the hard copy of your document. Before taking print you can also view the preview of your document. For this click the Print preview button,
To print the document:
Select Start -> Programs -> Microsoft Office -> Microsoft Office Excel 2003.
Inserting, Deleting and Renaming Sheets
By default Excel enables only three sheets. You can insert, add and delete sheet in existing worksheet according to your requirements.
To add a new sheet:
Click Insert -> Worksheet menu.
To delete a sheet:
Click Edit Delete sheet -> menu option to display message box.
Click Delete to delete the sheet permanently.
To rename a sheet:
Click Format Sheet -> Rename menu.
Specify a name such as my sheet at the base of the sheet.
Click OK to accept the changed name.
Joseph is working on Excel sheet. He wants to open Conditional Formatting dialog box. Which one of the following steps he should perform?
(A) Format -> Conditional Formatting
(B) Format -> Style -> Conditional Formatting
(C) Format -> Cells -> Conditional Formatting
(D) Format -> Sheet -> Conditional Formatting
(E) None of these
Answer: (A)
Explanation
Correct Option:
(A) Select FormatConditional Formatting to display the Conditioning Formatting dialog box.
Incorrect Options:
Rest of the options is incorrect.
Editing the style of text, numbers and the pages based on conditions are performed under ................option.
(A) Formatting
(B) Alignment
(C) Customize
(D) All of these
(E) None of these
Answer: (A)
Explanation
Correct Option:
(A) Formatting option allows you to edit style of text and numbers.
Incorrect Options:
(B) Alignment option allows you to align whole worksheet.
(C) Customization option allows you to customize excel interface.
Which one of the following statements is true?
Statement A: In 1984, Excel was invented for Apple Macintosh computer.
Statement B: By default Excel enables only two sheets
(A) Statement A is correct (B) Statement B is correct
(C) Both statement A and B are correct
(D) Neither statement A nor statement B is correct
(E) None of these
Answer: (A)
Explanation
Correct Option:
(A) Only statement A is true.
Incorrect Options:
Rest of the options is incorrect.
Formatting a Text and Numbers
Various formatting styles on Text and Numbers as per requirement are permitted by Excel. The document become more feasible, pleasing appearance also shows more values by using these formatting styles. You need to click a particular cell and start typing to enter data in the cell of worksheet. By pressing Tab and Arrow Keys of the keyboard you can enter the data.
Selecting Cell or Cell Range
If you want to perform any operation on data then you need to select cell or range of cells. You need to follow the following steps to select the cell or cells in a worksheet: (See Figure. 9.7.3)
Firstly click the cell which you want to select and same in case of range of cells, you need to press and the document through mouse in the starting cell.
Then move the mouse to destination or end cell and release it.
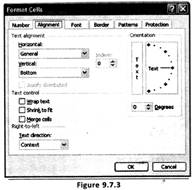
Text Alignment
It allows you to align the Text of the document.
Implementation of Text is done in the following ways:
Firstly select the cells on which you need a text to be aligned.
Then select Format Cells Alignment tab to open Format Cells dialog box, as shown in the following figure:
Further you need to select the desired option to align text vertically or horizontally in the Text alignment area.
Then click OK to accept the settings.
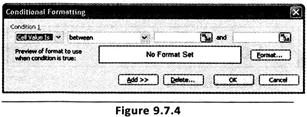
Implementation of Conditional
Formatting Editing the style of Text, numbers and the pages based on conditions are performed under formatting option. If the contents in the Cells satisfied those conditions then the formatting will take effect. Therefore, there is no need to make any changes and check the conditions manually. Implementation of Conditional formatting is done in the follow-
To display the Conditional Formatting dialog box, select Format -> Conditional
Formatting, as shown in the following figure:
Then select the type of condition from the dropdown list according to the requirement.
After that select the range of the cells which are in need.
Then to add more conditions click Add.
Finally to accept the changes click OK.
Formatting Text
As per the requirement you can format a Text, such as changing the font of Text from Arial to Times New Roman or by changing its size from 11 to 14. Formatting of Text can be done in a worksheet in the following ways: (See Figure. 9.7.5)
Firstly select the text, which needs to format.
Then to display the Font tabbed page, select Format -> Cells -> Font to open Format Cells dialog box, as shown in the more...
Concept of Worksheets and Workbooks
A single spreadsheet page is called worksheet. A workbook is a collection of all the worksheets in a single file. Basically workbook contains worksheet, such as a magazine contains page. In other words you can say a workbook is the MS Excel file allows maintaining and storing data. A worksheet is a collection of cells on a single sheet allows manipulating data.
Creating New Worksheet
To create a new worksheet on Excel, you require opening MS Excel. For opening an Excel sheet, you need to select Start then proceeding further to Programs then move to Microsoft Office and from there you need to select Microsoft Office Excel 2003. For future uses Excel provides the facilities of saving a document.
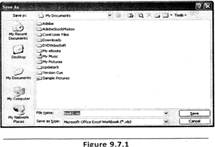
Saving a new file for the first time:
You need to click File -> Save as, to open the Save As dialog box, as shown in the following figure: (See Figure. 9.7.1)
Now select the exact location where you need to save the file.
Then provide a name to the particular file in the File name textbox place.
Finally click Save to save the particular file.
To save an existing file at different locations you need to perform the following:
Firstly open an existing file.
Then click File -> Save As to display the dialog box Save As.
Further select the location where you need to save the particular file.
Provide another name in the File name box, if you need to save/create at the same location another copy of same document.
Finally click Save to save/create another copy of the same file at desired location where you need it.
Ctrl + S shortcut key can also be used to save a file.
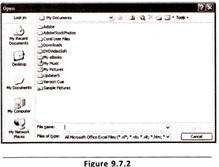
Opening an Existing Excel File
To open an existing file performs the following: (See Figure. 9.7.2)
Firstly select File -> Open menu option to display Open dialog box, as shown in the following figure:
Then select location such as E: drive, where you have already saved a file from the Look in list.
Thus select a particular file.
Finally click Open to open the desired file you want to open.
Which one of the following statements is true?
Statement A: Lotus SmartSuite is also known as Lotus SmartSuite was released in 2008.
Statement B: Lotus SmartSuite was released in 2005.
(A) Statement A is correct
(B) Statement B is correct
(C) Statement A and B are correct
(D) Neither statement A nor statement B is correct
Answer: (A)
Explanation
Correct Option:
(A) Only more...
Types of Spreadsheet Packages
Spreadsheets are useful for maintaining and analyzing numeric data. There are number of spreadsheet packages available, some are designed to work on specific operating system and, some can be used on different platform. Types of spreadsheet packages are the following:
Lotus 1-2-3 Release 9.8
Quattro Pro From Corel
GS-Calc
Microsoft Excel
Lotus 1-2-3 Release 9.8
Is also known as Lotus SmartSuite released in 2008. The main feature of this version is speech - enabled Smart Master templates, which allows users to perform common task using speech. Lotus 1-2-3 also allows performing several mathematical calculations, such as total and average.
Quattro Pro
Is offered by Corel. It contains notebook that are divided into worksheets. A notebook can contain multiple spreadsheets which are compatible with Excel.
GS-Calc
Has some interested features, such as more than 2 million rows, over 2000 columns, password protection and encryption. It also allows importing dBase II and IV and Excel files. GS - Calc allows 20,000 undo and redo levels.
Microsoft Excel
In 1984, Excel was invented for Apple Macintosh computer. It was the first Spreadsheet that provides GUI (Graphical User Interface). In 1987, Microsoft released Windows operating system. At that time Excel was the first spreadsheet that was developed for another operating system. Excel is very useful application software which is useful in number of areas, such as, financial accounting, solving complex engineering problems and creating business planning.
Introducing Spreadsheet
Worksheet environment which is used to manage numbers and calculation or provides an electronic worksheet is known as Excel. An Excel file, which contains several worksheets, is referred as a workbook. The text, numbers and formulas which enters in Excel is permitted by Worksheet. By default three worksheets are presented in every workbook. It promotes number of features that allows you to generate formulas which are automatically updated when you change plot numeric data and data in charts. It contains grid which is made up of columns and rows, thus it is used easily to perform mathematical calculations.
Applications related to worksheets are the following:
Financial accounting.
Helps in solving complex engineering problems.
Helps in inventory controls and formatting reports.
Helps in creating business planning.
Helps in preparing Invoice.
Rows and Columns are the main component of worksheets. A column and rows are the vertical and horizontal group of cells. Maximum numbers of columns you can enter in an Excel worksheet are 256. Whereas the maximum number of rows you can enter in that are 65,536 rows.
Basically there are five types of spreadsheets:
Arithmetic Spreadsheets: Enables number of arithmetic functions, such as sum, and average that help in arithmetic calculations.
Two-Dimensional Spreadsheets: Arranges data in rows and columns like a table.
Three - Dimensional Spreadsheet: Enables more than one two-dimensional sheet that stacks related spreadsheets on top of each Other.
Logical Spreadsheet: Enables logic functions rather than arithmetic functions that are used in deductive reasoning.
Object-Oriented Spreadsheets: Allows viewing, analyzing and mapping data in different ways/This type of spreadsheet is; organized by objects rather than using two dimensional cells.
Printing a presentation
PowerPoint allows printing slides. Before printing slides, you need to set them up according to your requirements, such as A4 Paper, on screen Slide Show and 35mm Slides. To set up the page:
Open the presentation and select Page Setup from File menu.
Select the output medium from Slides sized droop down list.
Set the orientation, such as Landscape.
Click OK.
To print a presentation:
Click File -> Print or Press Ctrl + P to open the Print dialog box, as shown in the following figure:
The Print dialog box contains Print What list that have the following options;
Slides: Allows one slide per page.
Handouts: Allows 1, 2, 3, 6 or 9 slides per page. Slides can be ordered vertically or horizontally.
Note Pages: Allows one slide per page with additional notes.
Outline View: Allows the text of slides in outline format,
Click OK.
Ravin prepares a presentation for college's annual function. He wants to apply custom animation in his presentation. Which one of the following steps he should perform to apply custom animation?
(A) Select slide show -> Custom Animation
(B) Select view show slide show -> Custom Animation
(C) Select view -> slide show -> Custom Animation
(D) Select slide show -> view -> Custom Animation
(E) None of these
Answer: (A)
Explanation
Correct Option:
(A) Select slide show Custom Animation.
Incorrect Options:
Rest of the options is incorrect.
PowerPoint allows printing slides. Before printing slides, you need to set them up according to your requirements. Which of the following options are available in Print what list?
(A) Slides
(B) Handouts
(C) Note Pages
(D) All of these
(E) None of these
Answer: (D)
Explanation
Correct Option:
(D) The print dialog box has Print What list that contains slides, handouts and note pages options.
Incorrect Options:
Rest of the options is incorrect.
Jack wants to run his power point presentation using short cut key. Which one of the following short cut keys Jack can use?
(A) Alt+F8
(B) F5
(C) F7
(D) F1
(E) None of these
Answer: (B)
Explanation
Correct Option:
(B) F5 key allows viewing show.
Incorrect Options:
(A) Alt + F8 allows adding Macros
(C ) F7 allows starting spell check.
(D) F1 allows opening of power point help.
PowerPoint 2003 allows saving a presentation as a web page.
Slide Pane: Enables you to view the text looks on each slide, you can add movies, graphics and sounds, add more...
 Pie chart of populations of English native speakers