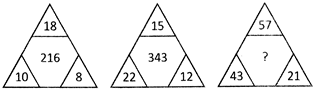
 (a) 1728 (b) 1331
(c) 729 (d) 512
(e) None of these
Ans. (b)
Explanation: Here the pattern is ________
\[{{(18+10+8)}^{\frac{3}{2}}}=216,\]
\[{{(15+12+22)}^{\frac{3}{2}}}=343,\]
\[{{(57+43+21)}^{\frac{3}{2}}}=1331\]
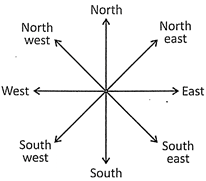
Direction Sense Problems
In such types of problems, we draw a diagram by using the given information. The following diagram shows all the directions in a proper manner.
(a) 1728 (b) 1331
(c) 729 (d) 512
(e) None of these
Ans. (b)
Explanation: Here the pattern is ________
\[{{(18+10+8)}^{\frac{3}{2}}}=216,\]
\[{{(15+12+22)}^{\frac{3}{2}}}=343,\]
\[{{(57+43+21)}^{\frac{3}{2}}}=1331\]
Direction Sense Problems
In such types of problems, we draw a diagram by using the given information. The following diagram shows all the directions in a proper manner.
 Blood-Relations Problems
In such types of problems, we should first be clear on the relations given in the following table:
Mother's father \[\to \] Maternal grand father
Mother's mother \[\to \] Maternal grand mother
Husband of aunt \[\to \]Uncle
Wife of maternal uncle \[\to \] Maternal aunt
Mother's brother \[\to \] Maternal uncle
Mother's sister \[\to \] Maternal aunt
Children of maternal uncle/aunt \[\to \]Cousins
Father's father \[\to \]Paternal grand father
Father's mother \[\to \]Paternal grand mother
Father's brother \[\to \] Uncle
Father's sister \[\to \] Aunt
Children of uncle \[\to \]Cousins
Blood-Relations Problems
In such types of problems, we should first be clear on the relations given in the following table:
Mother's father \[\to \] Maternal grand father
Mother's mother \[\to \] Maternal grand mother
Husband of aunt \[\to \]Uncle
Wife of maternal uncle \[\to \] Maternal aunt
Mother's brother \[\to \] Maternal uncle
Mother's sister \[\to \] Maternal aunt
Children of maternal uncle/aunt \[\to \]Cousins
Father's father \[\to \]Paternal grand father
Father's mother \[\to \]Paternal grand mother
Father's brother \[\to \] Uncle
Father's sister \[\to \] Aunt
Children of uncle \[\to \]Cousins
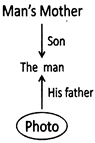 Clearly the photo belongs to man's son/so the man is the father of the person shown in the photo.
Figure Based Problems
In such types of problems, a series of figures is given which proceeds with a certain rule or pattern.
Clearly the photo belongs to man's son/so the man is the father of the person shown in the photo.
Figure Based Problems
In such types of problems, a series of figures is given which proceeds with a certain rule or pattern.
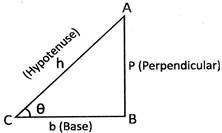 Then the trigonometrical ratios are defined as follows:
 Basic Logic Gates
Basic logic gates are logic circuits which are made of a single logic gate. It is made of transistor and capacitors. The output of the basic logic gate is depend on the switching of transistor.
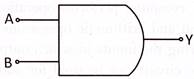
AND Gate
AND gate has two input and one output. The output of the AND gate is also written as, Y = A.B. Output of the AND gate is obtained by multiplying both the input. The input of the AND gate is given as logic high and logic low or 0 and 1. Every logic gate has a truth table which is the statement of input given to the logic gate and output obtained by that logic gate.
Look at the following symbol of the AND gate:
Basic Logic Gates
Basic logic gates are logic circuits which are made of a single logic gate. It is made of transistor and capacitors. The output of the basic logic gate is depend on the switching of transistor.
AND Gate
AND gate has two input and one output. The output of the AND gate is also written as, Y = A.B. Output of the AND gate is obtained by multiplying both the input. The input of the AND gate is given as logic high and logic low or 0 and 1. Every logic gate has a truth table which is the statement of input given to the logic gate and output obtained by that logic gate.
Look at the following symbol of the AND gate:
 Look at the following truth table of the AND gate:
| Input | Output | |
| A | B | Y = A.B |
| 0 | 0 | 0 |
| 0 | 1 | 0 |
| 1 | 0 | 0 |
| 1 | 1 | 1 |
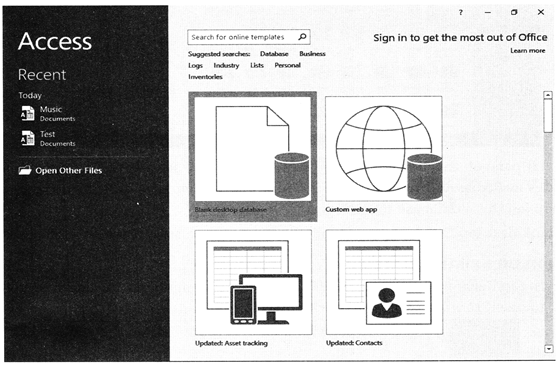 In the example below, the featured templates are selected, and the template options are displayed in the center area of the screen. Featured templates include database template options that are available online, as well as templates available as part of the local version Access.
Opening a database
You have three main options on the Getting Started page. You can open a template database stored locally or online, an existing database, or a blank database.
To view templates included with Access:
v Click on Blank desktop database and click on create option.
v Now the screen will change to main screen of the database.
In the example below, the featured templates are selected, and the template options are displayed in the center area of the screen. Featured templates include database template options that are available online, as well as templates available as part of the local version Access.
Opening a database
You have three main options on the Getting Started page. You can open a template database stored locally or online, an existing database, or a blank database.
To view templates included with Access:
v Click on Blank desktop database and click on create option.
v Now the screen will change to main screen of the database.
 more...
  In Healthcare
The use of information and communication technologies has become widespread in the health care sector. Computer plays very important role in medical science. Today, more and more members of the medical profession are embracing social media for sharing helpful medical information and providing patient care.
Computers can be used to perform research in the health sector. Research studies can be done more...
In Healthcare
The use of information and communication technologies has become widespread in the health care sector. Computer plays very important role in medical science. Today, more and more members of the medical profession are embracing social media for sharing helpful medical information and providing patient care.
Computers can be used to perform research in the health sector. Research studies can be done more... 


You need to login to perform this action.
You will be redirected in
3 sec

